Fig. 9
Download original image
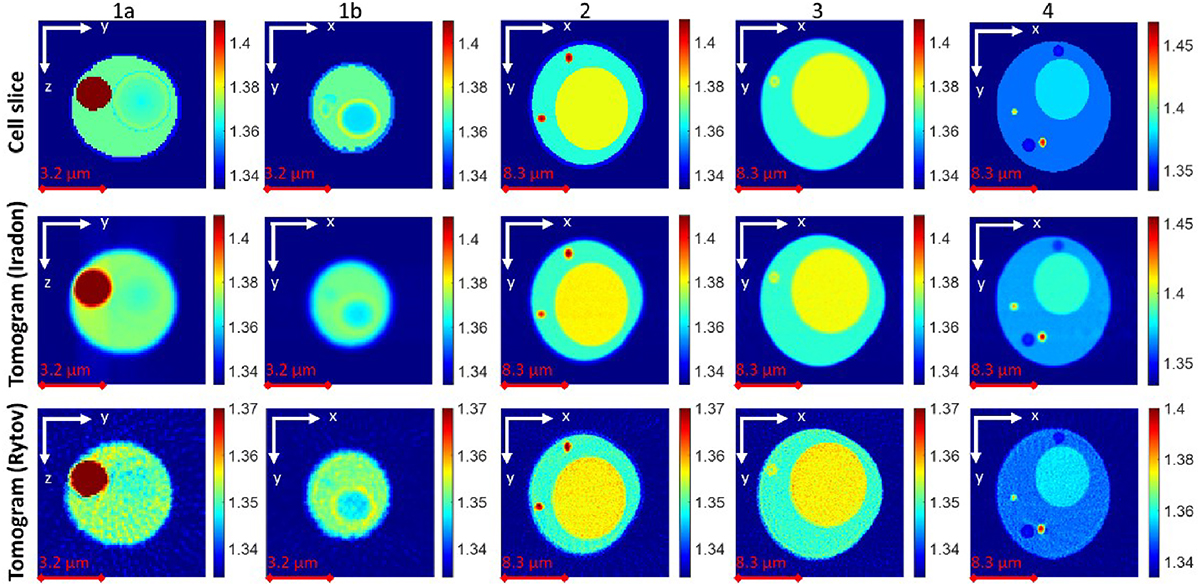
application of the introduced pipeline to the simulated cells displayed in this work. Top row, slices from the simulated cells; Middle row, corresponding slices of the reconstructed simulated tomogram through the filtered backprojection routine. Bottom row, corresponding slices of the reconstructed simulated tomogram through the filtered backpropagation routine. Columns 1a and 1b refer to Simulation 1 with 1 and 7 cytoplasmic vacuoles respectively, columns 2, 3 and 4 refer to Simulation 2, 3 and 4. An equally spaced angular sequence was used, with the angles ranging from 0 to 360° with a step of 5°.
Current usage metrics show cumulative count of Article Views (full-text article views including HTML views, PDF and ePub downloads, according to the available data) and Abstracts Views on Vision4Press platform.
Data correspond to usage on the plateform after 2015. The current usage metrics is available 48-96 hours after online publication and is updated daily on week days.
Initial download of the metrics may take a while.