Fig. 6
Download original image
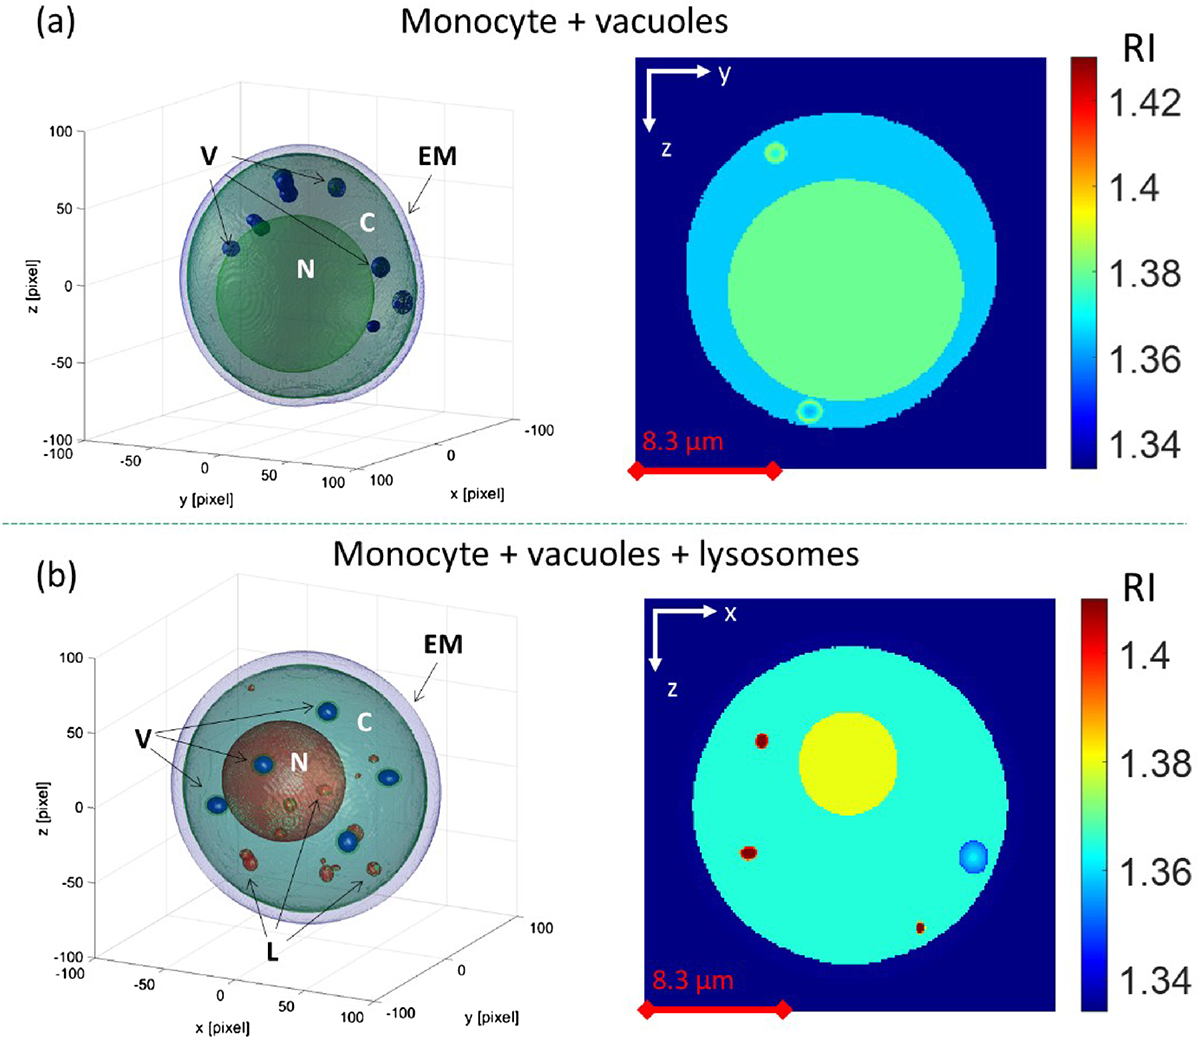
Results for the simulations of monocytes with cytoplasmic vacuoles and monocytes with cytoplasmic vacuoles and lysosomes. Top panel, (a), an isolevel visualization and a yz slice from a simulated cell, highlighting the positioning of the vacuoles and their spatially-varying RI distribution (Visualization 4). Bottom panel, (b), an isolevel visualization and an xz slice from a simulated cell, where the high RI and numerosity of lysosomes can be appreciated (Visualization 5). EM = External membrane, C = Cytoplasm, N = Nucleus, V = Vacuoles, L = Lysosomes. For each cell, the isolevels’ thresholds for the visualization are set with respect to the maximum value of the simulated RI.
Current usage metrics show cumulative count of Article Views (full-text article views including HTML views, PDF and ePub downloads, according to the available data) and Abstracts Views on Vision4Press platform.
Data correspond to usage on the plateform after 2015. The current usage metrics is available 48-96 hours after online publication and is updated daily on week days.
Initial download of the metrics may take a while.