Fig. 5
Download original image
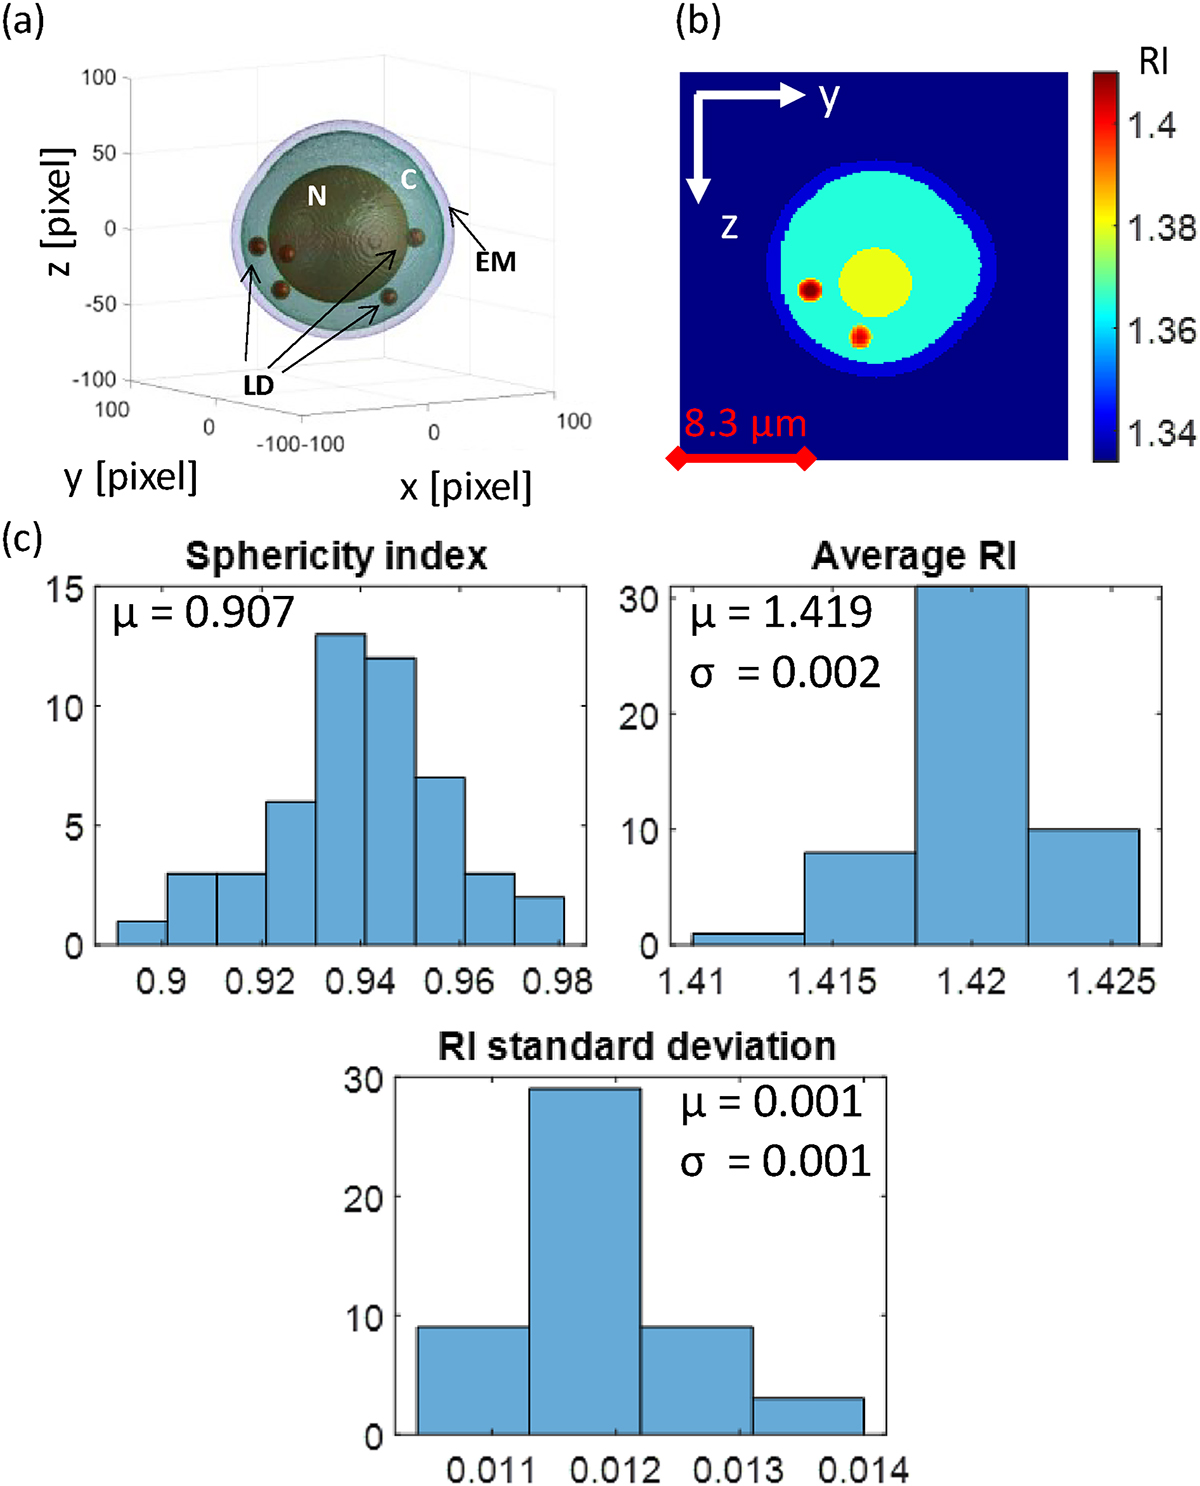
results for the simulations of a monocyte with LDs (Visualization 3). (a) Isolevel. From this visualization, the size and the positioning of the LDs can be seen, compared to the overall cell; (b) yz cut of the simulated 3D RI distribution. The non uniform distribution of RI into the LD can be noticed; (c) Histograms of the sphericity index, average RI and standard deviation values are evaluated for the LDs in a population of 50 monocytes. μ = mean value. σ = standard deviation. EM = External membrane, C = Cytoplasm, N = Nucleus, LD = Lipid Droplets. For each cell, the isolevels’ thresholds for the visualization are set with respect to the maximum value of the simulated RI profile.
Current usage metrics show cumulative count of Article Views (full-text article views including HTML views, PDF and ePub downloads, according to the available data) and Abstracts Views on Vision4Press platform.
Data correspond to usage on the plateform after 2015. The current usage metrics is available 48-96 hours after online publication and is updated daily on week days.
Initial download of the metrics may take a while.