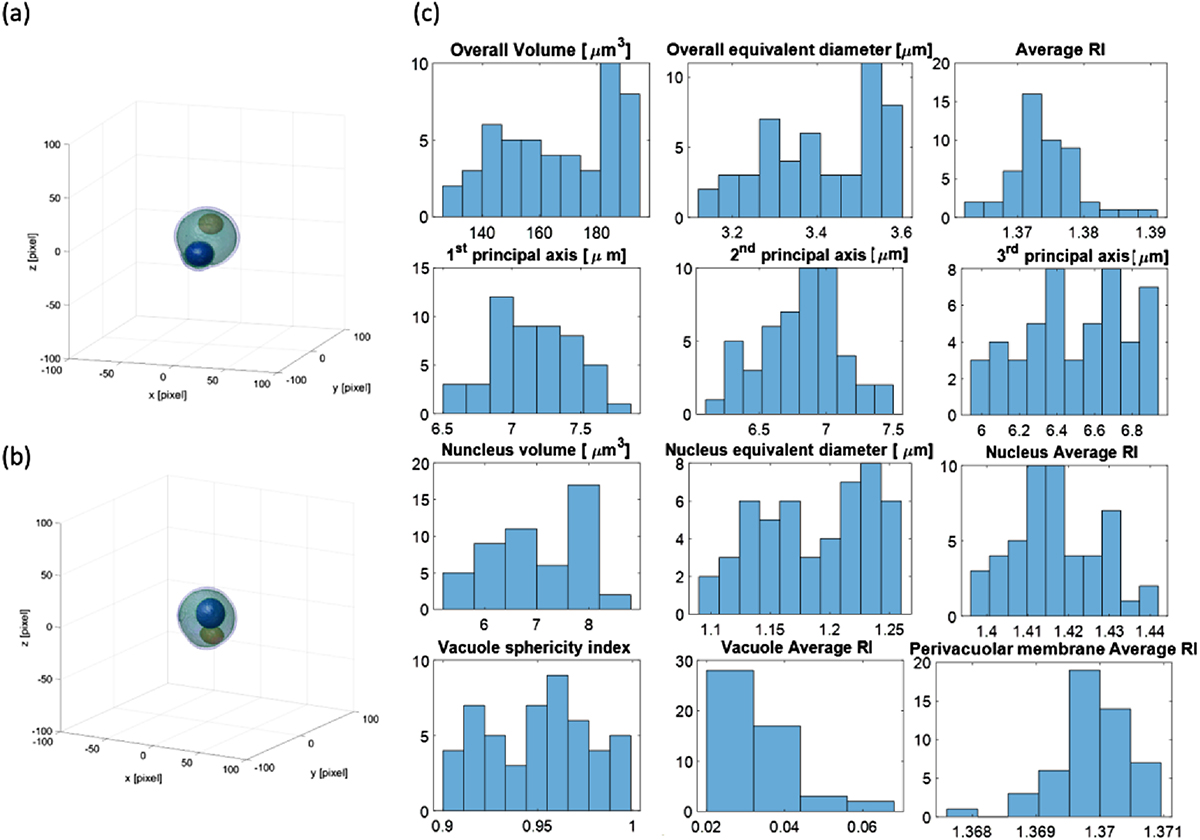
Fig. 4
Download original image
simulation results for late-G1 yeast cells. (a, b) isolevels of two different simulated cs; (c) Histograms of some relevant statistics evaluated over a population of 50 cells. For each cell, the isolevels’ thresholds for the visualization are set with respect to the maximum value of the simulated RI profile. The statistics are in good accordance with the ones in the literature.
Current usage metrics show cumulative count of Article Views (full-text article views including HTML views, PDF and ePub downloads, according to the available data) and Abstracts Views on Vision4Press platform.
Data correspond to usage on the plateform after 2015. The current usage metrics is available 48-96 hours after online publication and is updated daily on week days.
Initial download of the metrics may take a while.