Fig. 3
Download original image
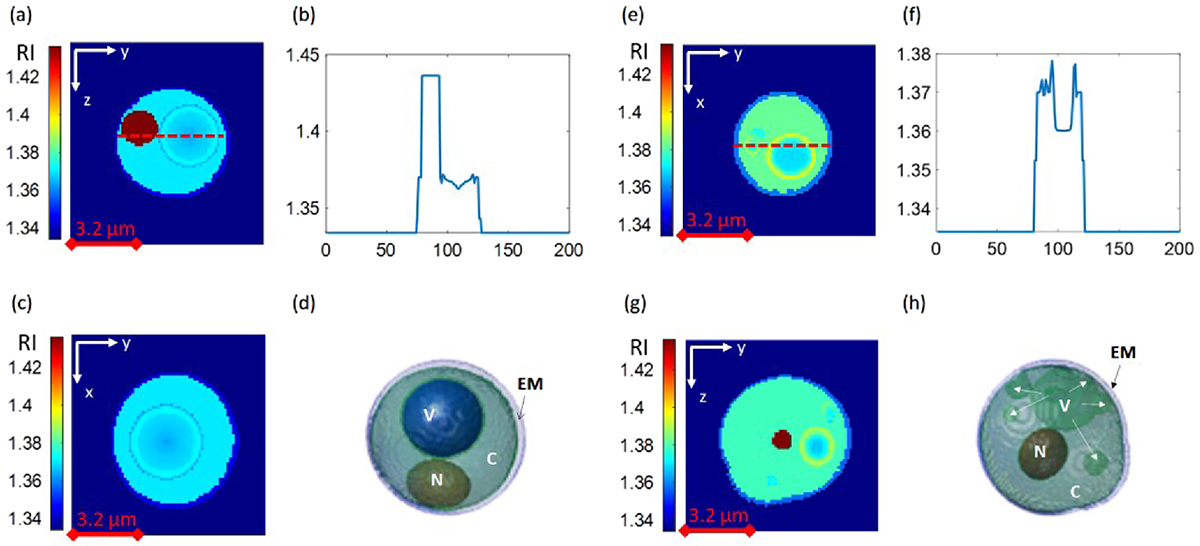
simulation results for (a–d) a yeast cell with a large vacuole inside (Visualization 1) and (e–h) a yeast cell with a large vacuole and a multitude of smaller vacuoles (Visualization 2). (a, g) Visualization of a slice in the yz plane from the 3D RI profiles; (b, f) Cut along the red dotted line in subfigures (a, e), highlighting the RI profile into the vacuole; (c, e) Visualization of a slice in the xy plane from the 3D RI profiles; (d, h) Isolevel visualizations. EM = External membrane, C = Cytoplasm, N = Nucleus, V = Vacuole. For each cell, the isolevels’ thresholds for the visualization are set with respect to the maximum value of the simulated RI profile.
Current usage metrics show cumulative count of Article Views (full-text article views including HTML views, PDF and ePub downloads, according to the available data) and Abstracts Views on Vision4Press platform.
Data correspond to usage on the plateform after 2015. The current usage metrics is available 48-96 hours after online publication and is updated daily on week days.
Initial download of the metrics may take a while.