Open Access
Fig. 10
Download original image
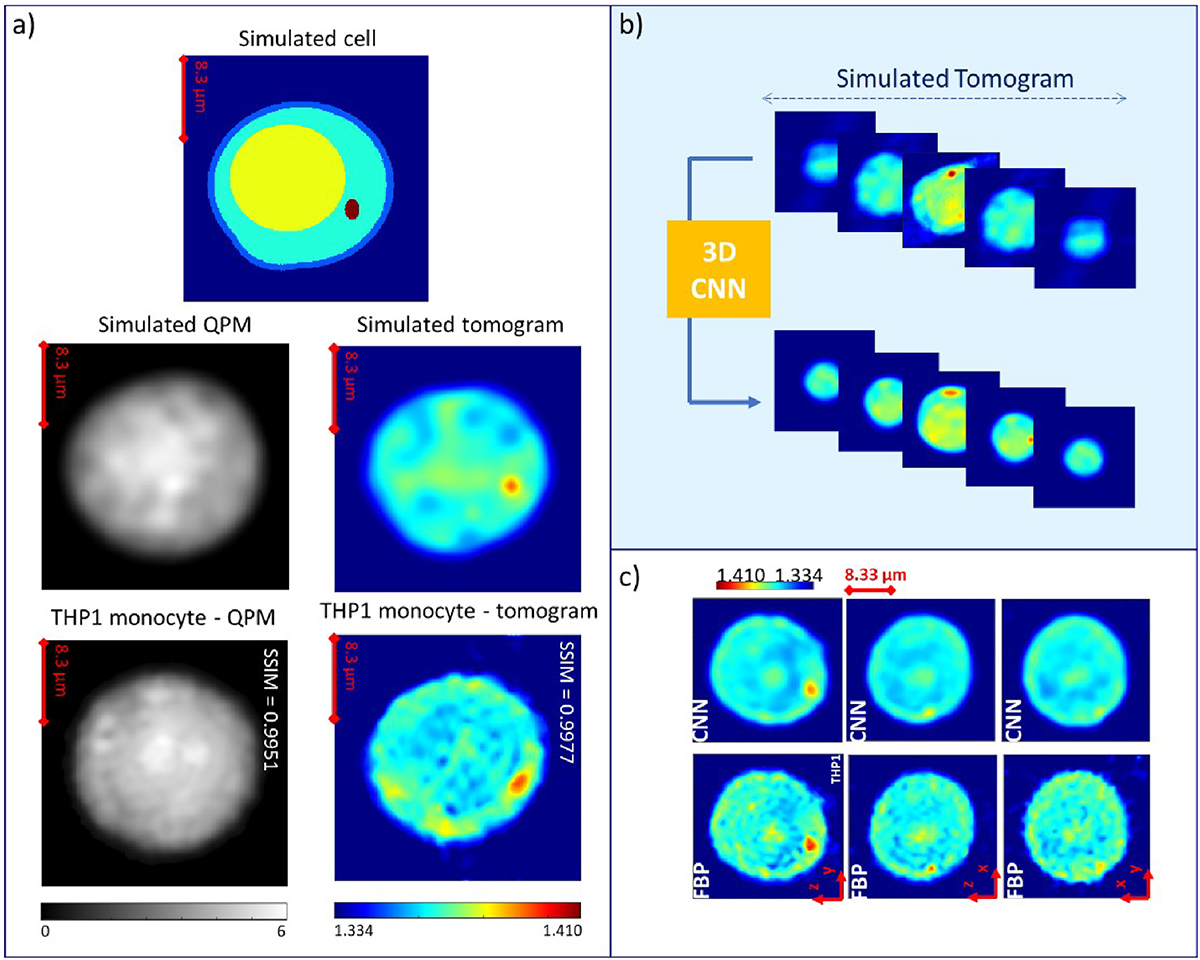
application of the proposed simulated model to an experimental context. a), comparison between the simulated QPM and tomogram and the experimental ones. b), training of a CNN using a simulated dataset. c), reconstruction of an experimental tomogram via filtered backprojection (FBP) and via CNN.
Current usage metrics show cumulative count of Article Views (full-text article views including HTML views, PDF and ePub downloads, according to the available data) and Abstracts Views on Vision4Press platform.
Data correspond to usage on the plateform after 2015. The current usage metrics is available 48-96 hours after online publication and is updated daily on week days.
Initial download of the metrics may take a while.