Figure 2
Download original image
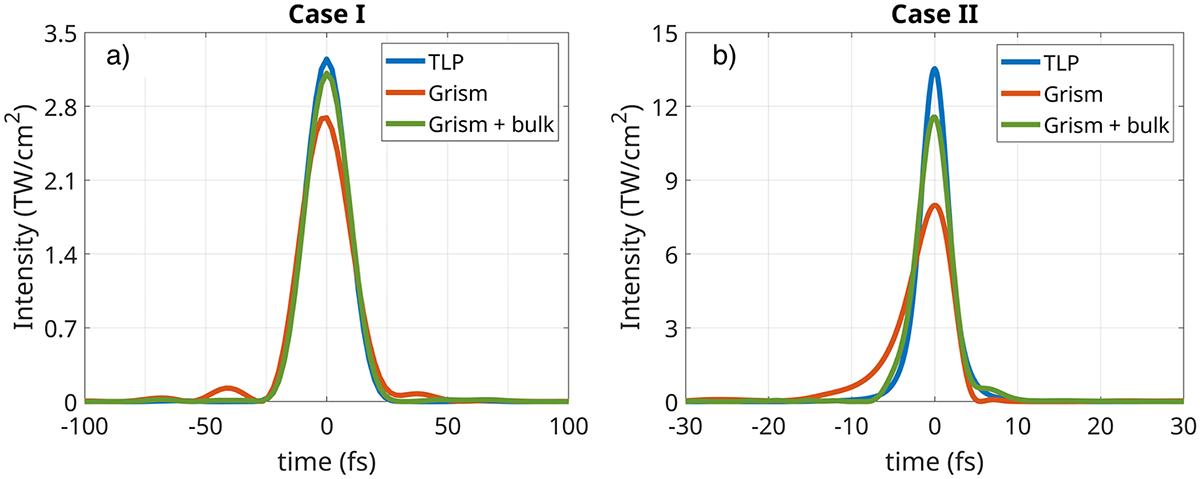
Intensity distribution of the TLP (blue line) for case I (a) and case II (b), showing the compressed pulse using a grism-only compressor (red line) and the compressed pulse with an additional SF10 glass piece to the grism pair (green line), with configurations described in Table 1 (rows 1–2 for case I, rows 3–4 for case II).
Current usage metrics show cumulative count of Article Views (full-text article views including HTML views, PDF and ePub downloads, according to the available data) and Abstracts Views on Vision4Press platform.
Data correspond to usage on the plateform after 2015. The current usage metrics is available 48-96 hours after online publication and is updated daily on week days.
Initial download of the metrics may take a while.