Open Access
Figure 6
Download original image
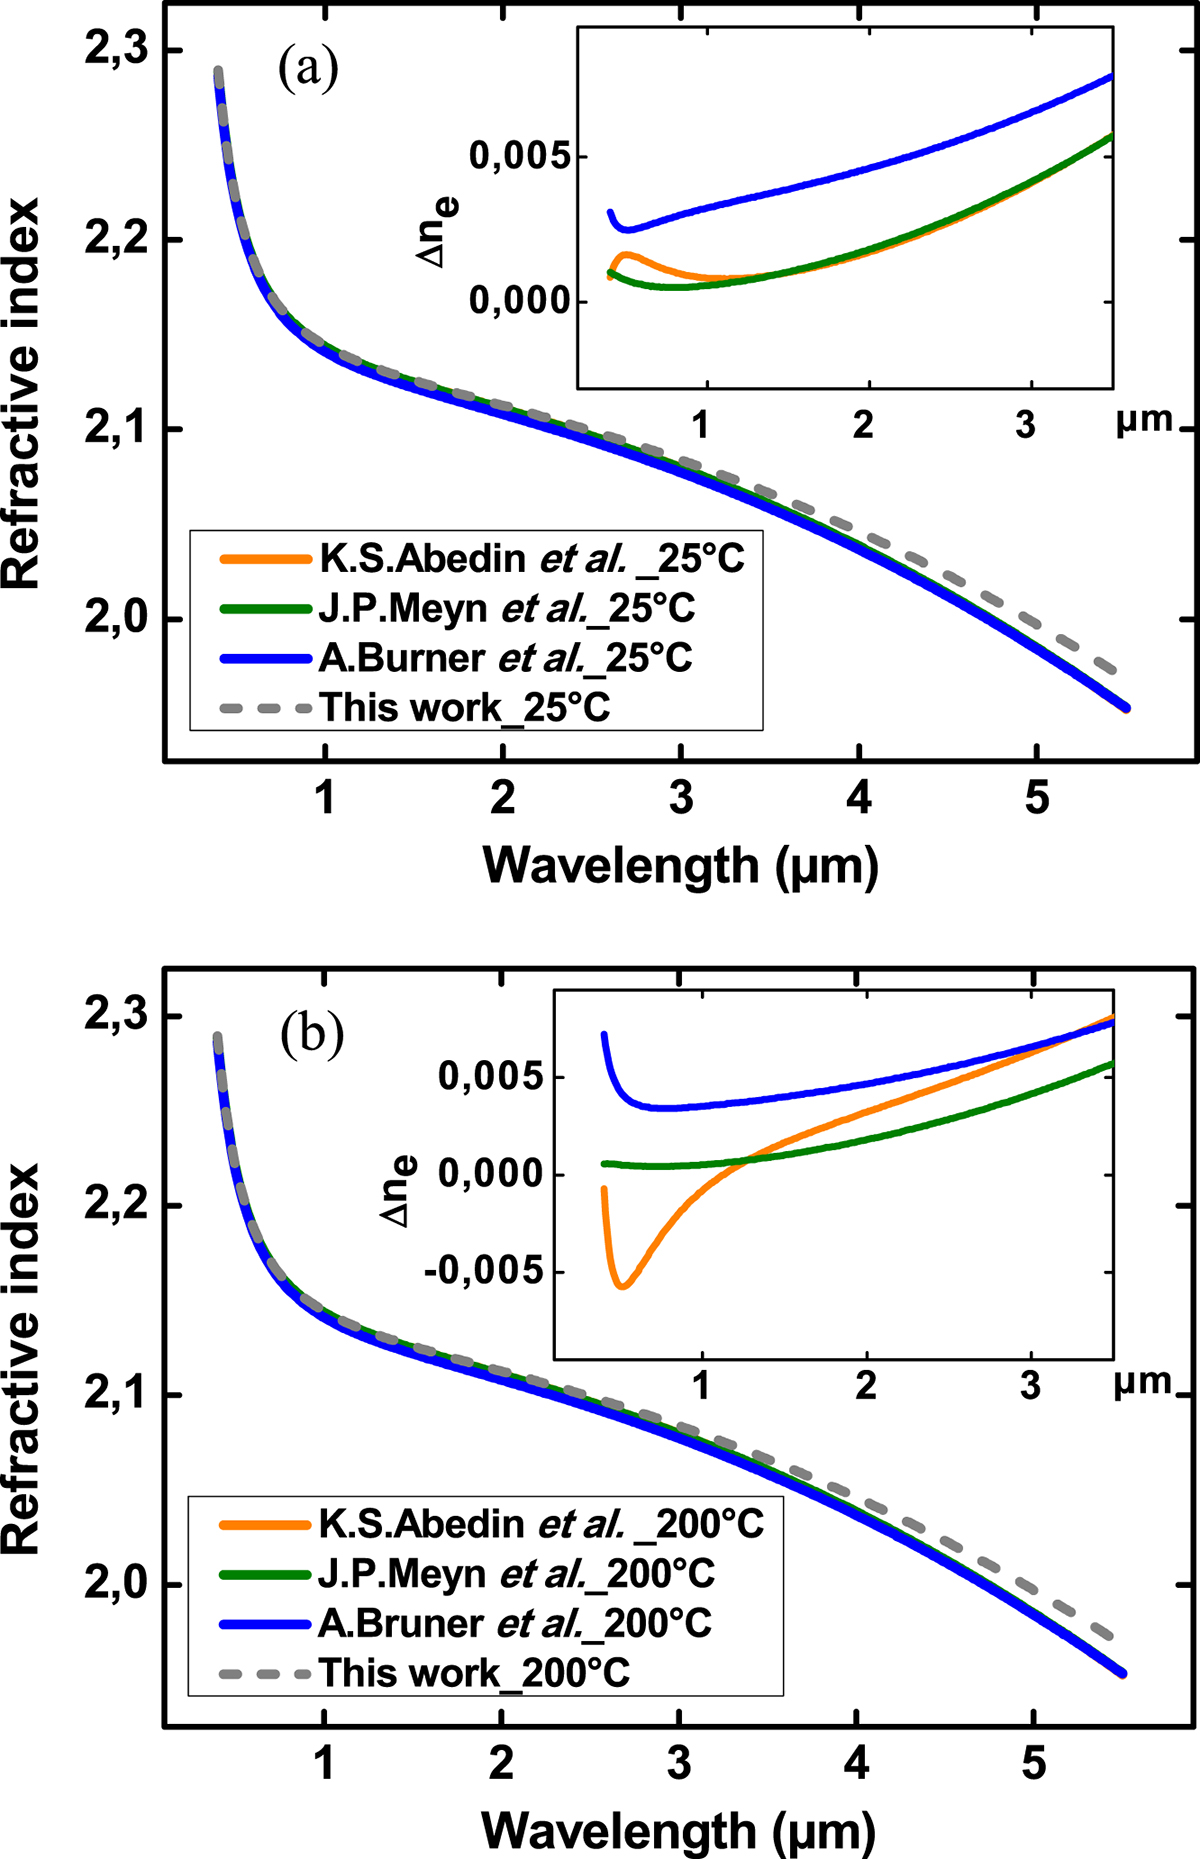
Comparison of the extraordinary refractive index dispersion ne as a function of wavelength obtained using the previous Sellmeier equations and the new proposed equation. (a) T = 25 °C and (b) T = 200 °C. The zooms represent the difference of refractive index values obtained with the new equation and the previous ones.
Current usage metrics show cumulative count of Article Views (full-text article views including HTML views, PDF and ePub downloads, according to the available data) and Abstracts Views on Vision4Press platform.
Data correspond to usage on the plateform after 2015. The current usage metrics is available 48-96 hours after online publication and is updated daily on week days.
Initial download of the metrics may take a while.