Fig. 6
Download original image
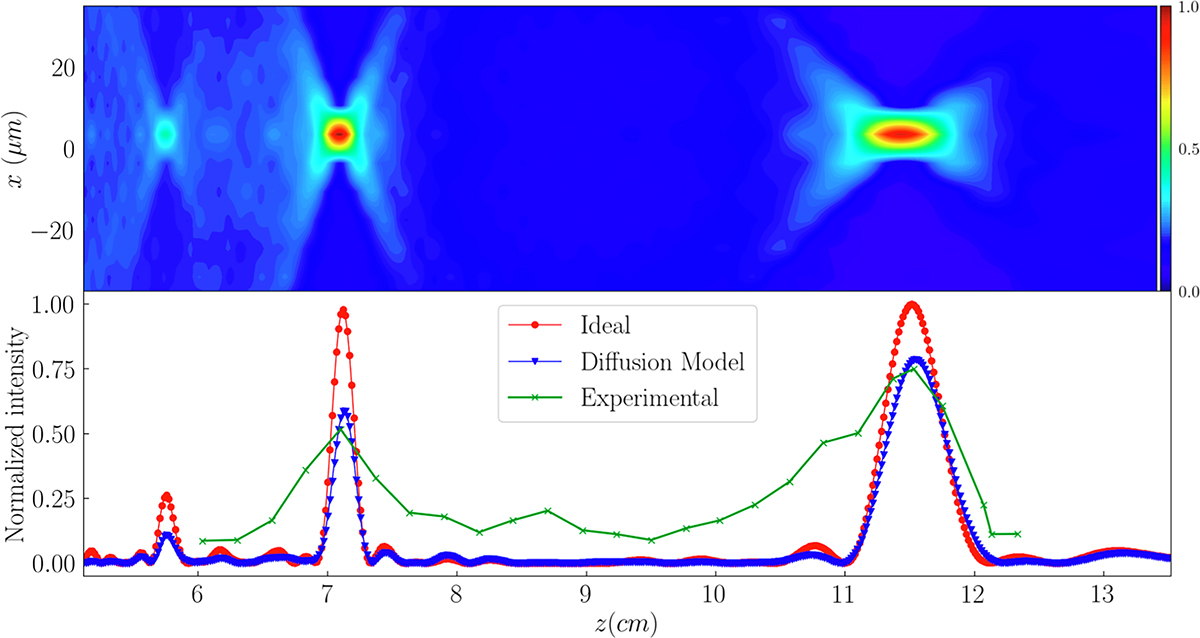
Evolution of the axial and transverse intensity distribution for a ![]() Fibonacci Lens with a radius of
Fibonacci Lens with a radius of ![]() mm and the result obtained using the proposed diffusion model and the experimental results. Heat map plot corresponds to the intensity distribution of an ideal FL.
mm and the result obtained using the proposed diffusion model and the experimental results. Heat map plot corresponds to the intensity distribution of an ideal FL.
Current usage metrics show cumulative count of Article Views (full-text article views including HTML views, PDF and ePub downloads, according to the available data) and Abstracts Views on Vision4Press platform.
Data correspond to usage on the plateform after 2015. The current usage metrics is available 48-96 hours after online publication and is updated daily on week days.
Initial download of the metrics may take a while.