Fig. 5
Download original image
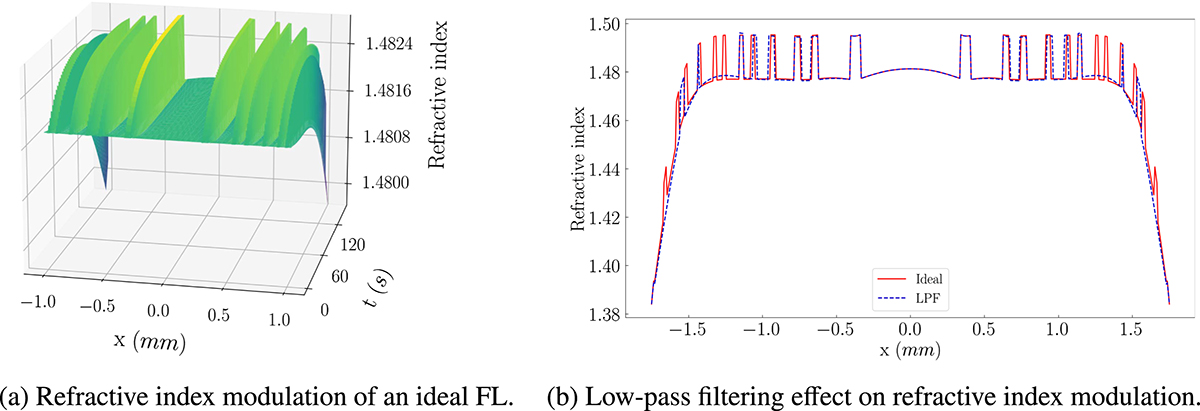
In (a), the refractive index modulation due to the diffusion process during the recording of the FL phase into the photopolymer is represented. Therefore, in (b), a refractive index modulation slice is represented for the ideal lens and low-pass filtering. Red and blue curves represent the ideal refractive index modulation and low-pass effect, respectively.
Current usage metrics show cumulative count of Article Views (full-text article views including HTML views, PDF and ePub downloads, according to the available data) and Abstracts Views on Vision4Press platform.
Data correspond to usage on the plateform after 2015. The current usage metrics is available 48-96 hours after online publication and is updated daily on week days.
Initial download of the metrics may take a while.