Fig. 10
Download original image
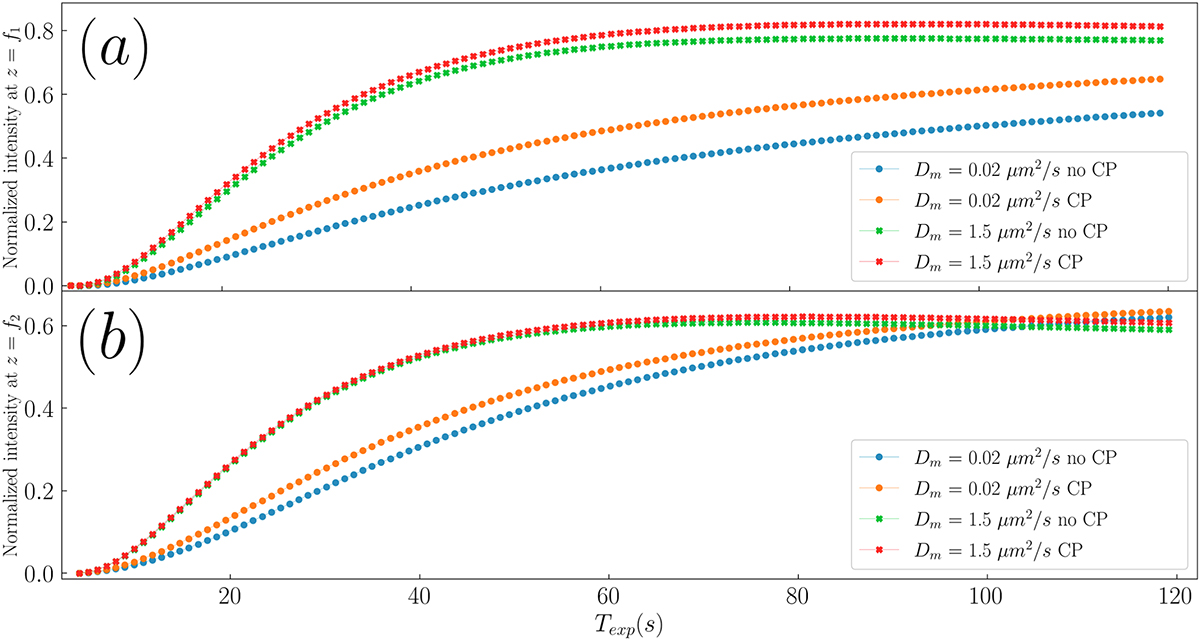
Evolution of the diffracted intensity at each focal point for a FL with ![]() ). Each curve corresponds to a different value of mean diffusivity,
). Each curve corresponds to a different value of mean diffusivity, ![]() , with low-pass filtering, and with or without coverplating. The label “no CP” in the green and blue dotted curves indicate the cases where coverplating technique was not used.
, with low-pass filtering, and with or without coverplating. The label “no CP” in the green and blue dotted curves indicate the cases where coverplating technique was not used.
Current usage metrics show cumulative count of Article Views (full-text article views including HTML views, PDF and ePub downloads, according to the available data) and Abstracts Views on Vision4Press platform.
Data correspond to usage on the plateform after 2015. The current usage metrics is available 48-96 hours after online publication and is updated daily on week days.
Initial download of the metrics may take a while.