Figure 4
Download original image
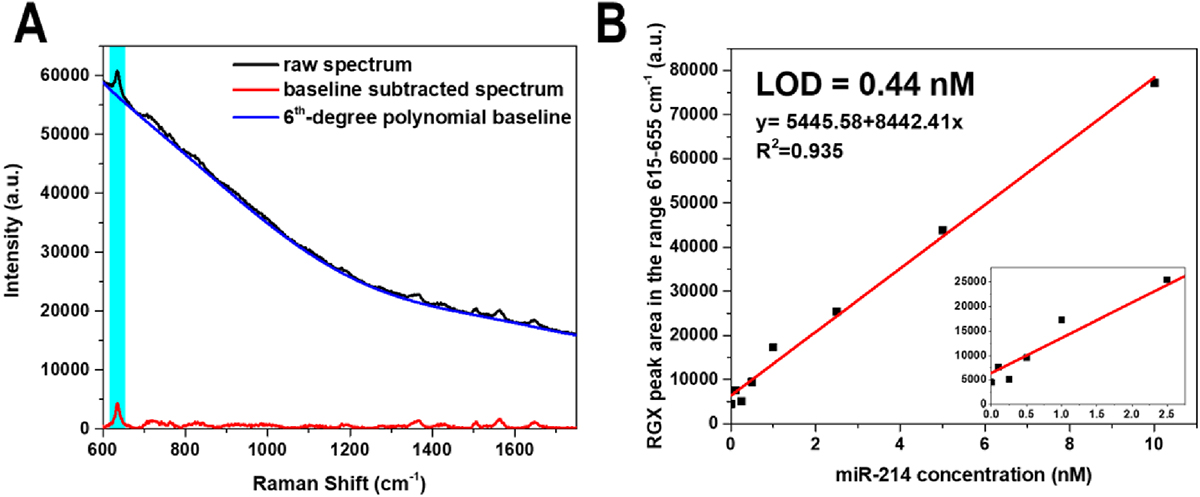
(A) Example of automatic baseline subtraction concerning the analysis of 10 nM miR-214 (main vibrational band of RGX at 635 cm−1, light blue bar); (B) linear regression of the calibration curve obtained by the automatic analysis of the spectra measured with the portable Raman spectrometer. The inset highlights the trend at the lowest miRNA concentrations.
Current usage metrics show cumulative count of Article Views (full-text article views including HTML views, PDF and ePub downloads, according to the available data) and Abstracts Views on Vision4Press platform.
Data correspond to usage on the plateform after 2015. The current usage metrics is available 48-96 hours after online publication and is updated daily on week days.
Initial download of the metrics may take a while.