Figure 3
Download original image
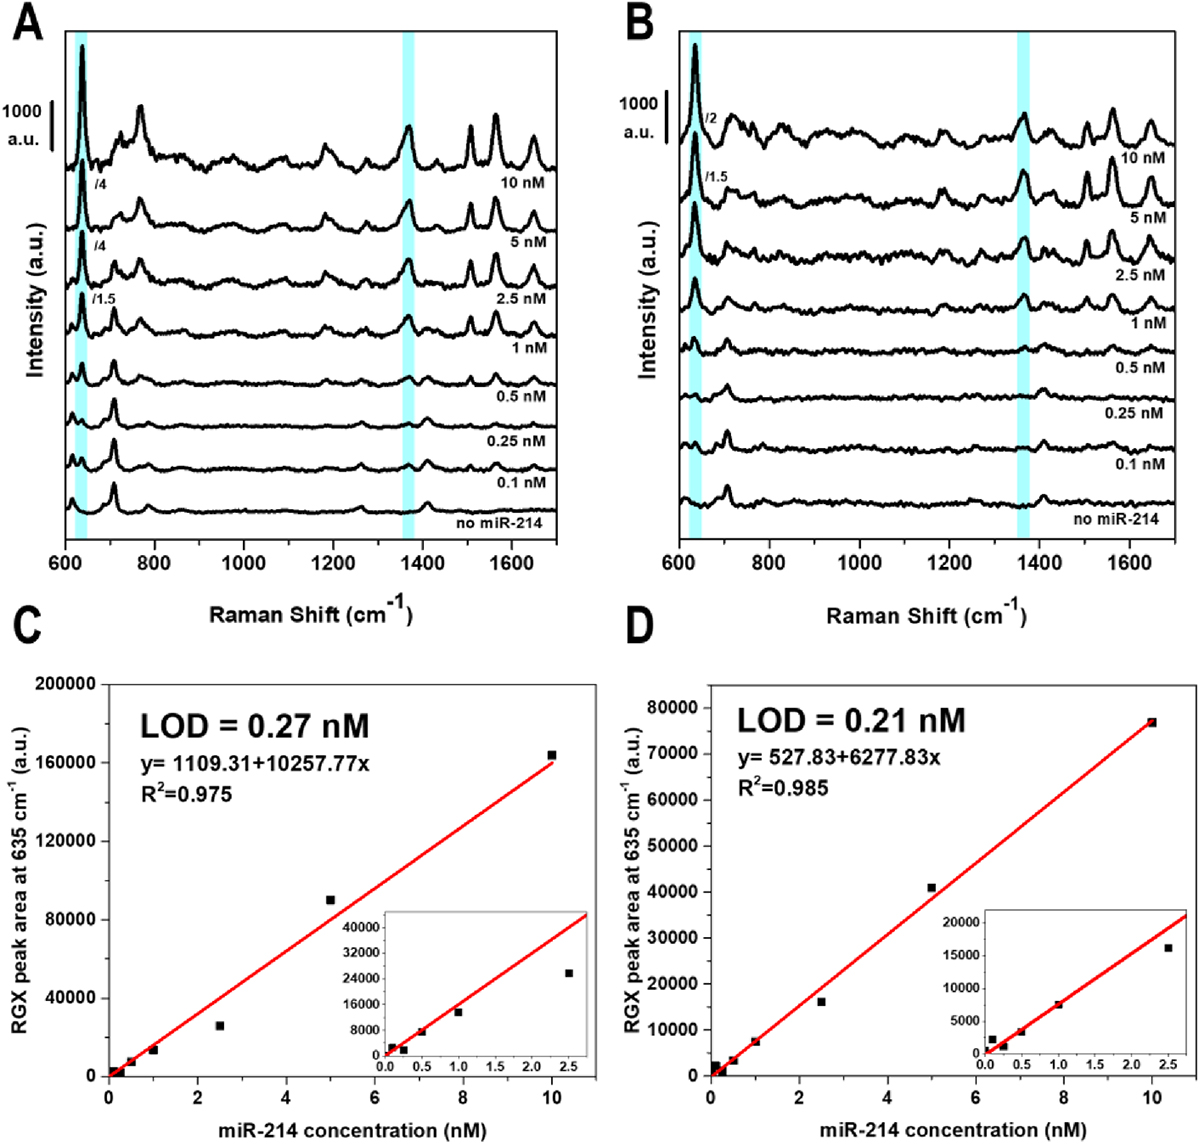
SERS spectra obtained by measuring the plasmonic nanostructures integrated in microfluidic chips and functionalized according to the two-step assay for the detection of miR-214 (0.1–10 nM), by means of (A) the bench (acquisition time 60 s, laser power 0.2 mW) or (B) the portable (acquisition time 10 s, laser power 3.8 mW) Raman spectrometers. The light blue bars highlight the main vibrational bands of RGX reporter. Linear regression of the calibration curves relative to the in-chip SERS analysis of miR-214; (C) obtained with the bench spectrometer; (D) obtained with the portable setup; the insets highlight the trend at the lowest miRNA concentrations.
Current usage metrics show cumulative count of Article Views (full-text article views including HTML views, PDF and ePub downloads, according to the available data) and Abstracts Views on Vision4Press platform.
Data correspond to usage on the plateform after 2015. The current usage metrics is available 48-96 hours after online publication and is updated daily on week days.
Initial download of the metrics may take a while.