Fig. 4
Download original image
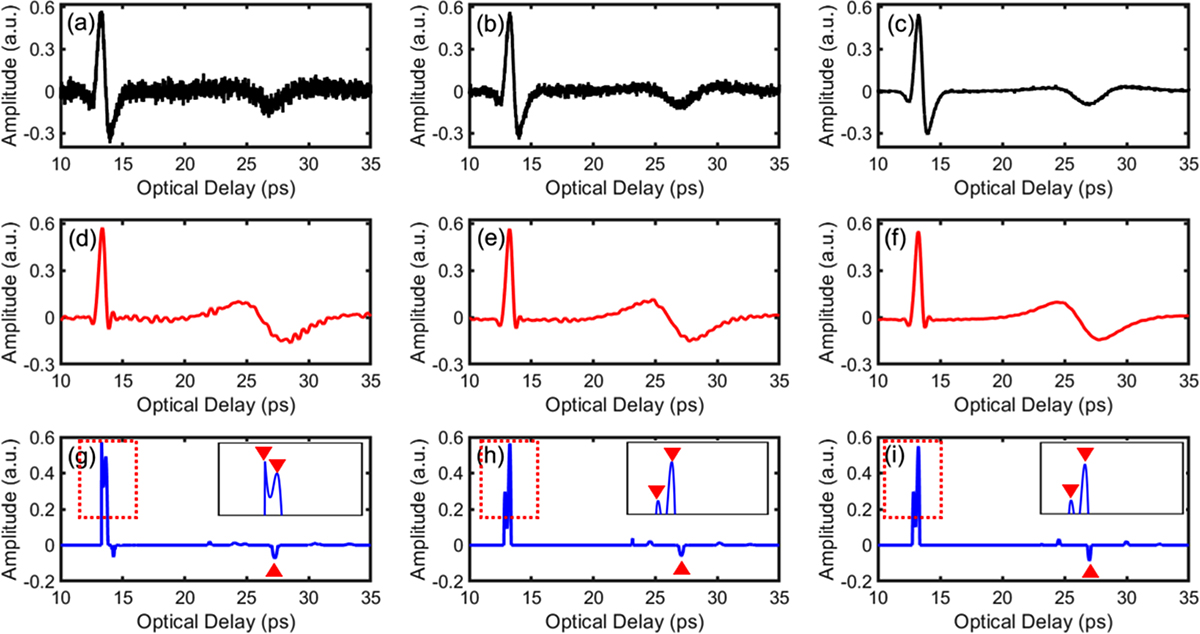
Comparison between the raw synthetic reflected signal under various noise levels and the corresponding deconvolved results. (a)–(c) the synthetized reflected signals with 5 dB, 10 dB, and 20 dB, respectively. (d)–(f) the deconvolved results h(t) by FWDD. (g)–(i) the deconvolved results h(t) by adaptive SD/TWIST. Inset in (g)–(i) is the Zoom-in version of the deconvolved result between 12 ps and 16 ps.
Current usage metrics show cumulative count of Article Views (full-text article views including HTML views, PDF and ePub downloads, according to the available data) and Abstracts Views on Vision4Press platform.
Data correspond to usage on the plateform after 2015. The current usage metrics is available 48-96 hours after online publication and is updated daily on week days.
Initial download of the metrics may take a while.