Open Access
Fig. 2
Download original image
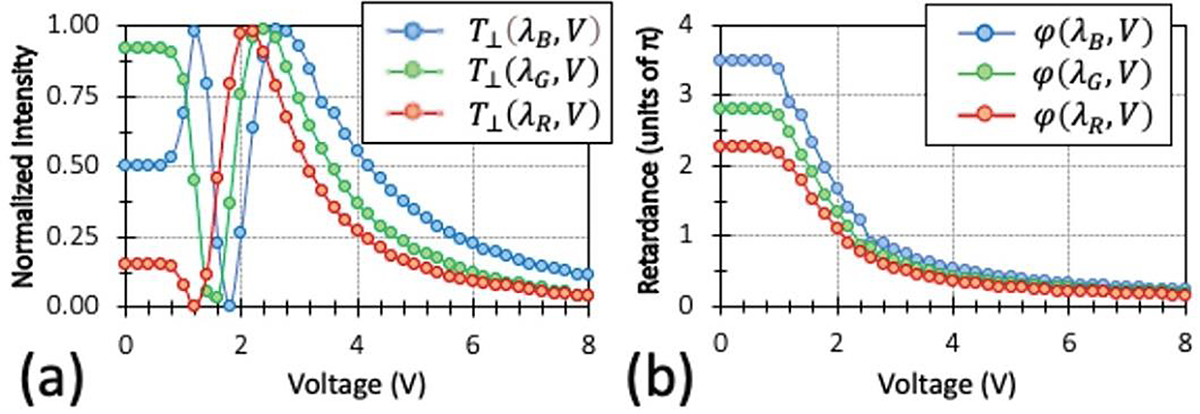
Example of calibration of an LCR device in the MM imaging polarimeter. (a) Transmission T⊥(V) between crossed polarizers oriented at 45° with respect to the LC director. (b) LCR retardance φ(V). Both graphs show the results for the three bands, with central wavelengths 470 nm (B), 565 nm (G) and 660 nm (R).
Current usage metrics show cumulative count of Article Views (full-text article views including HTML views, PDF and ePub downloads, according to the available data) and Abstracts Views on Vision4Press platform.
Data correspond to usage on the plateform after 2015. The current usage metrics is available 48-96 hours after online publication and is updated daily on week days.
Initial download of the metrics may take a while.