Open Access
Fig. 9
Download original image
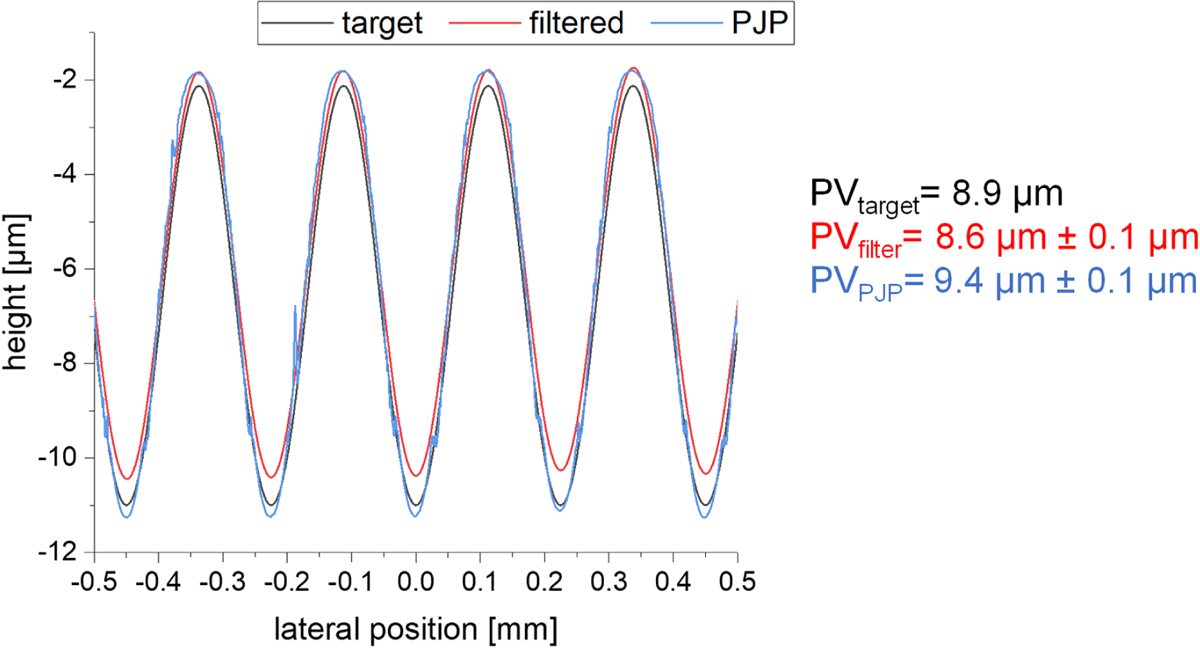
Cross section profiles of the structures after PJP (blue curve) and the filtered laser-structured topography (red curve) compared to the target profiles (black curve) measured over a length of n = 5ω. The PV values are given in addition.
Current usage metrics show cumulative count of Article Views (full-text article views including HTML views, PDF and ePub downloads, according to the available data) and Abstracts Views on Vision4Press platform.
Data correspond to usage on the plateform after 2015. The current usage metrics is available 48-96 hours after online publication and is updated daily on week days.
Initial download of the metrics may take a while.