Open Access
Figure 6
Download original image
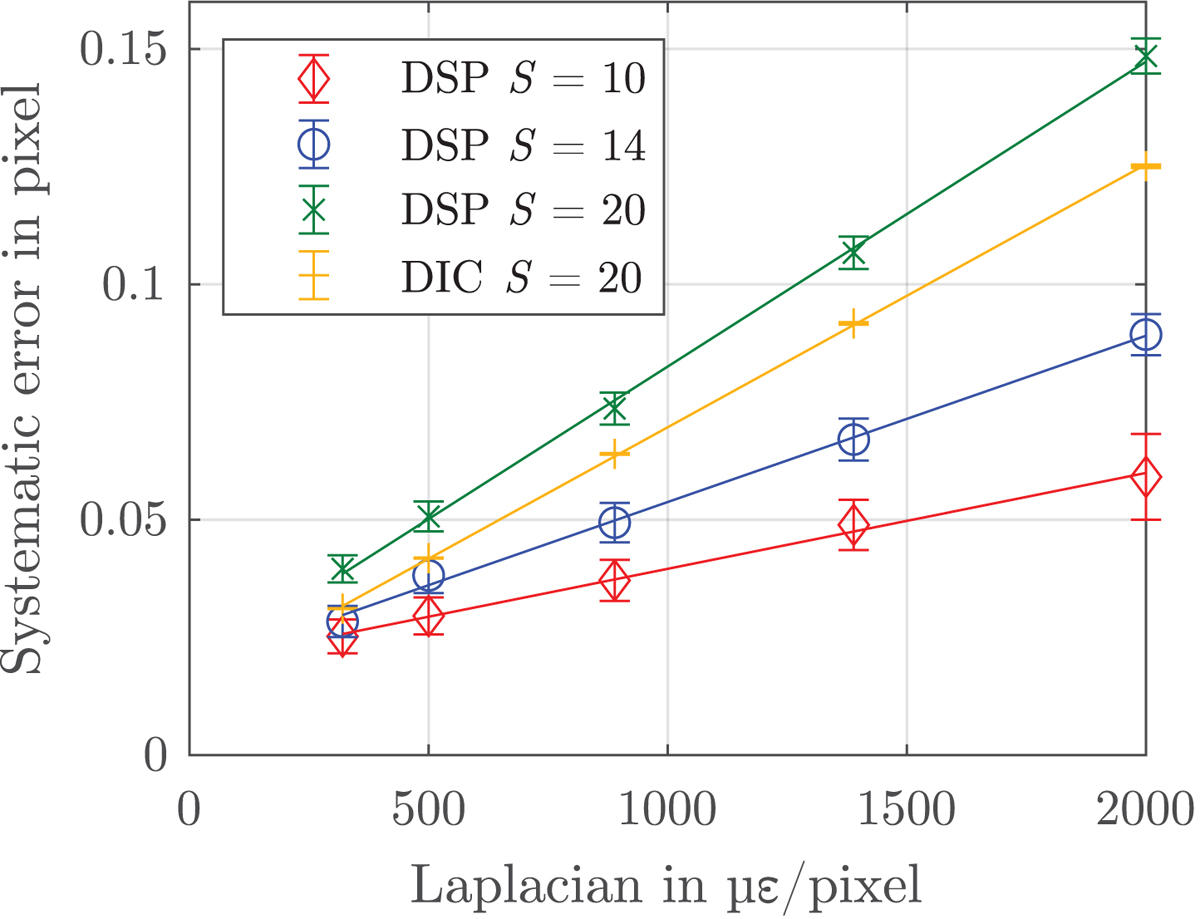
Systematic error over the Laplacian for different subset sizes ![]() . The solid lines are linear fits through the data points and the error bars represent the respective random error. The error values are evaluated from laser speckle patterns (DSP) and evaluated directly from the deformed surface topography (DIC).
. The solid lines are linear fits through the data points and the error bars represent the respective random error. The error values are evaluated from laser speckle patterns (DSP) and evaluated directly from the deformed surface topography (DIC).
Current usage metrics show cumulative count of Article Views (full-text article views including HTML views, PDF and ePub downloads, according to the available data) and Abstracts Views on Vision4Press platform.
Data correspond to usage on the plateform after 2015. The current usage metrics is available 48-96 hours after online publication and is updated daily on week days.
Initial download of the metrics may take a while.