Fig. 3
Download original image
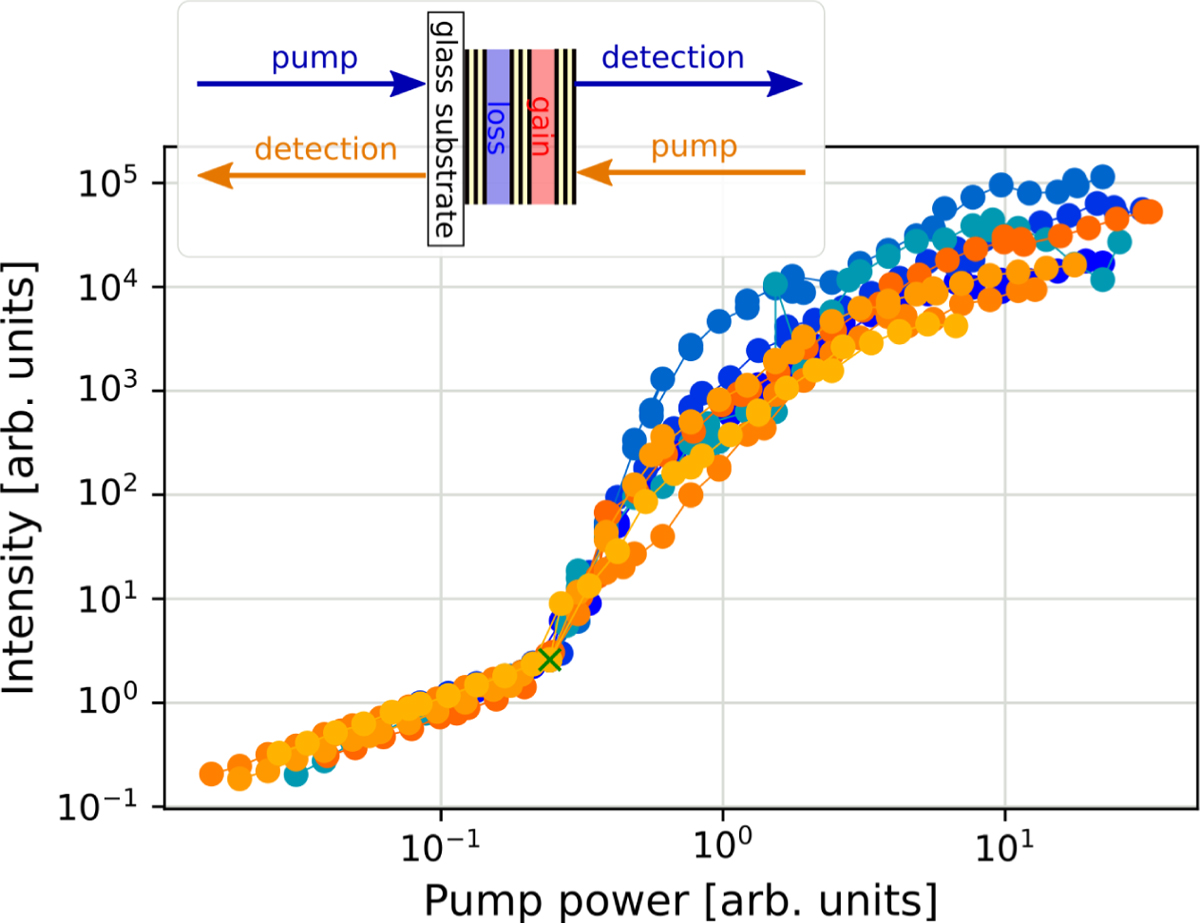
Input–output characteristics in forward direction (blue curves, see inset) show an up to one order higher output intensity compared to backward direction measurements (orange curves) in some pump power regimes. The curves stem from different spots on a coupled cavity device. All curves are shifted along x- and y-direction to coincide before lasing starts (green cross), see main text for further information. Pump power ranges for every curve from 10−1 μW to 102 μW energy input into the sample.
Current usage metrics show cumulative count of Article Views (full-text article views including HTML views, PDF and ePub downloads, according to the available data) and Abstracts Views on Vision4Press platform.
Data correspond to usage on the plateform after 2015. The current usage metrics is available 48-96 hours after online publication and is updated daily on week days.
Initial download of the metrics may take a while.