


Figure 2
Download original image
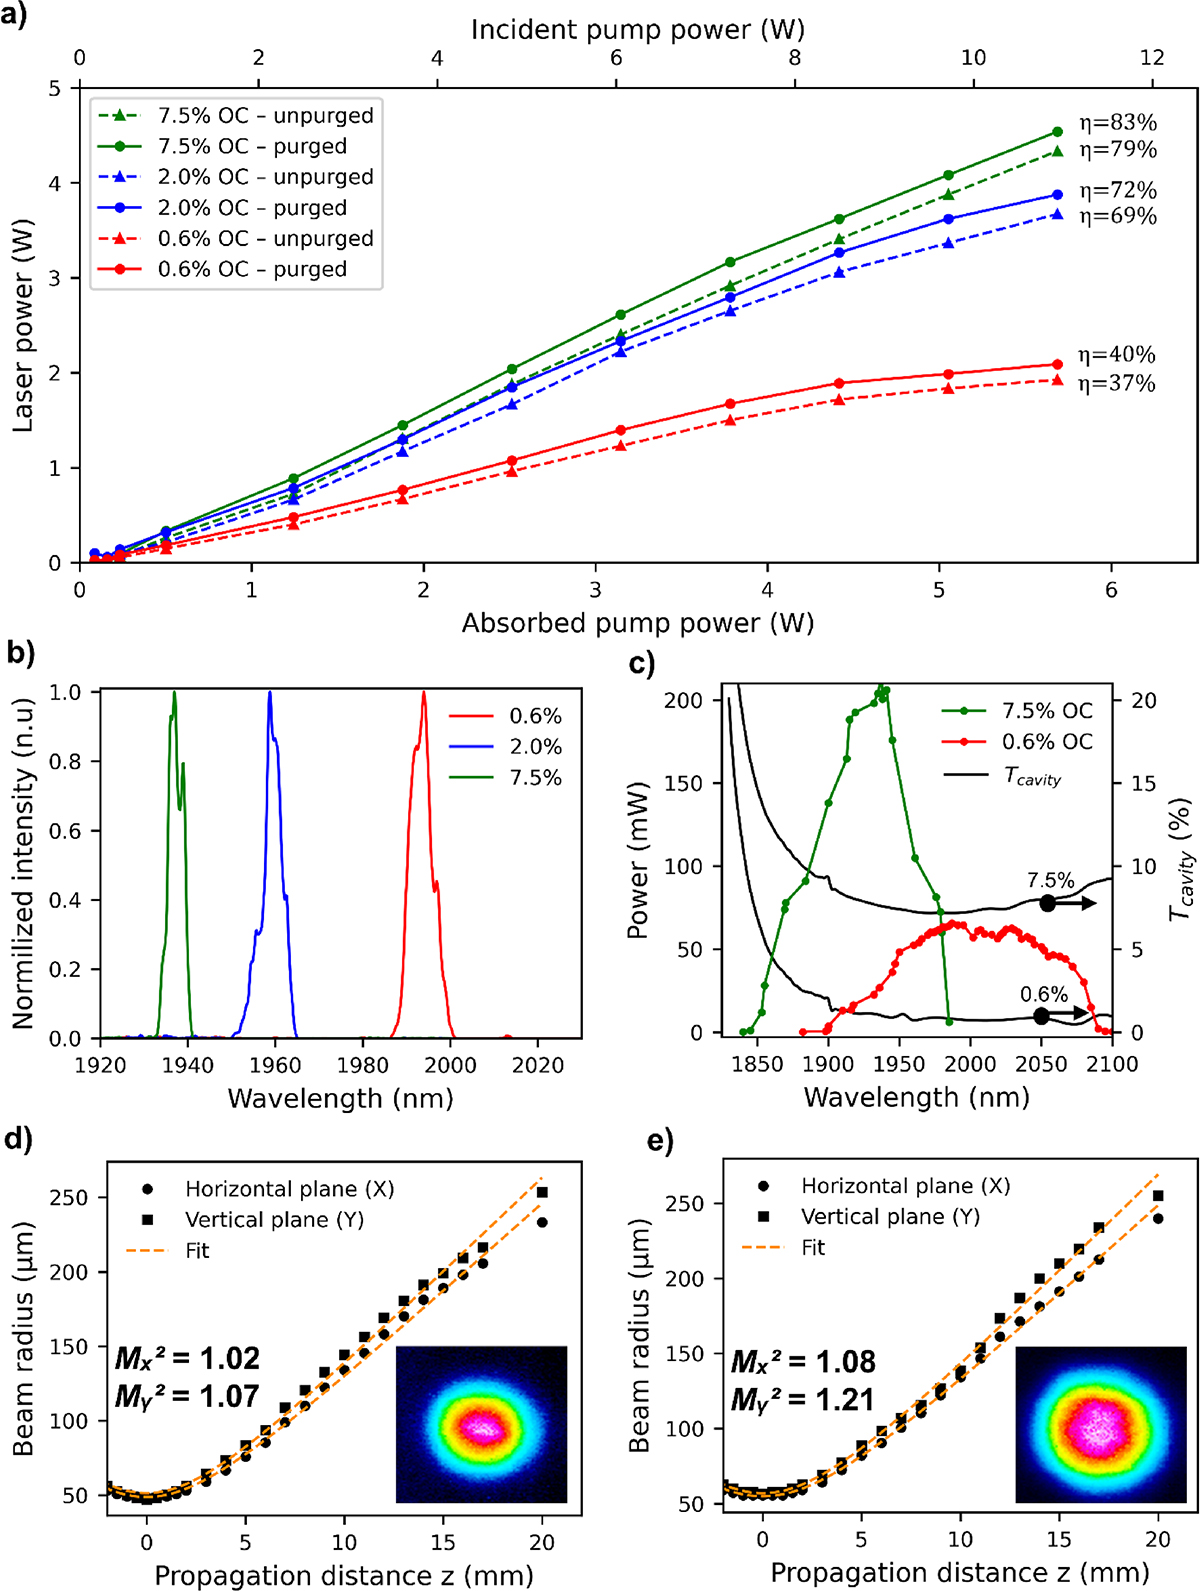
(a) Output power versus absorbed (bottom axis) and incident (top axis) pump power for three output couplers (OC = 0.6% in red, 2% in blue, 7.5% in green) in free air (dashed) and under dry-air purging (solid). The slope efficiencies with respect to absorbed pump power are indicated next to each curve. (b) Normalized laser spectra for the three OCs in the purged cavity. (c) Wavelength tuning with OC = 0.6% (red) and OC = 7.5% (green) at pump powers slightly above threshold for purged operation; the calculated total cavity transmission (Tcavity(%)) for each configuration is shown in black (right axis). (d) Measurement results of the beam propagation parameter M2 for low power operation Ppump = 1 W, yielding Plaser = 0.26 W with corresponding M2 fits; the inset shows the transverse beam profile. (e) same as (d) but for high-power operation at Ppump = 10 W, yielding Plaser = 3.9 W.
Current usage metrics show cumulative count of Article Views (full-text article views including HTML views, PDF and ePub downloads, according to the available data) and Abstracts Views on Vision4Press platform.
Data correspond to usage on the plateform after 2015. The current usage metrics is available 48-96 hours after online publication and is updated daily on week days.
Initial download of the metrics may take a while.