Figure 3
Download original image
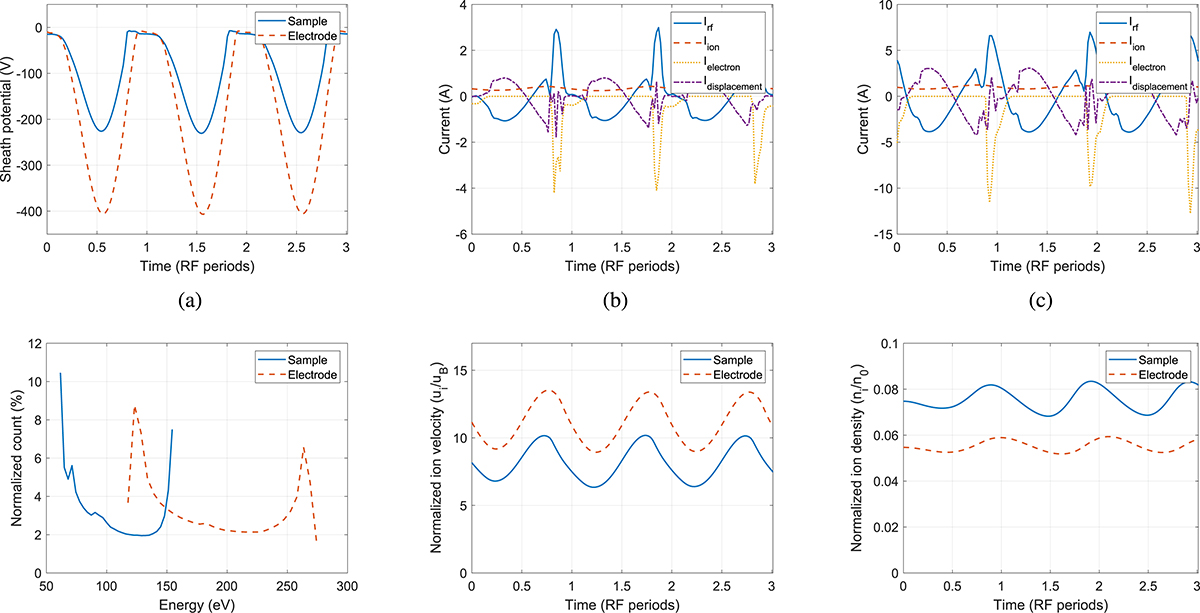
Results of simulations with sample height h = 2 mm and radius r = 50 mm. (a) Potential drop across plasma sheath, (b) and (c) current waveforms for the sample and the open part of the electrode respectively, (d) ion energy distribution (IED), (e) and (f) ion velocity and density waveforms. In (a), (d)–(f) the red-dashed line is for the open electrode path in EEC, and the blue line is for the sample path in EEC.
Current usage metrics show cumulative count of Article Views (full-text article views including HTML views, PDF and ePub downloads, according to the available data) and Abstracts Views on Vision4Press platform.
Data correspond to usage on the plateform after 2015. The current usage metrics is available 48-96 hours after online publication and is updated daily on week days.
Initial download of the metrics may take a while.