Figure 8
Download original image
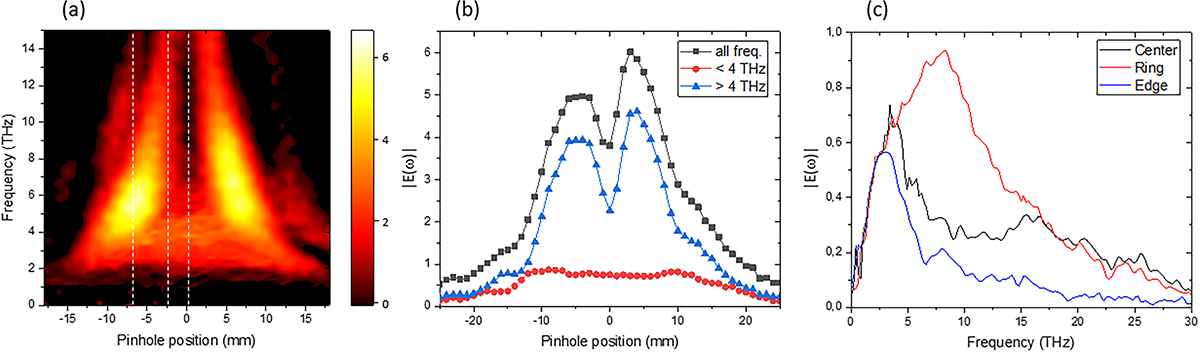
Aperture-scanning-assisted ABCD technique. The drilled mirror has been covered by an ITO plate. (a) Evolution of THz amplitude as a function of frequency and pinhole position. (b) Integrated spectra for different spectral bandwidths. (c) Amplitude of the spectra at three different positions of the pinhole, as indicated by the dashed line in (a). “Center” refers to 0 mm (spectrum at the center of the THz beam), “Ring” refers to −2.5 mm (spectrum along the emission cone emitted at high frequency, above 12 THz), “Edge” refers to −7 mm (spectrum at the edge of the emission cone).
Current usage metrics show cumulative count of Article Views (full-text article views including HTML views, PDF and ePub downloads, according to the available data) and Abstracts Views on Vision4Press platform.
Data correspond to usage on the plateform after 2015. The current usage metrics is available 48-96 hours after online publication and is updated daily on week days.
Initial download of the metrics may take a while.