Open Access
Figure 5
Download original image
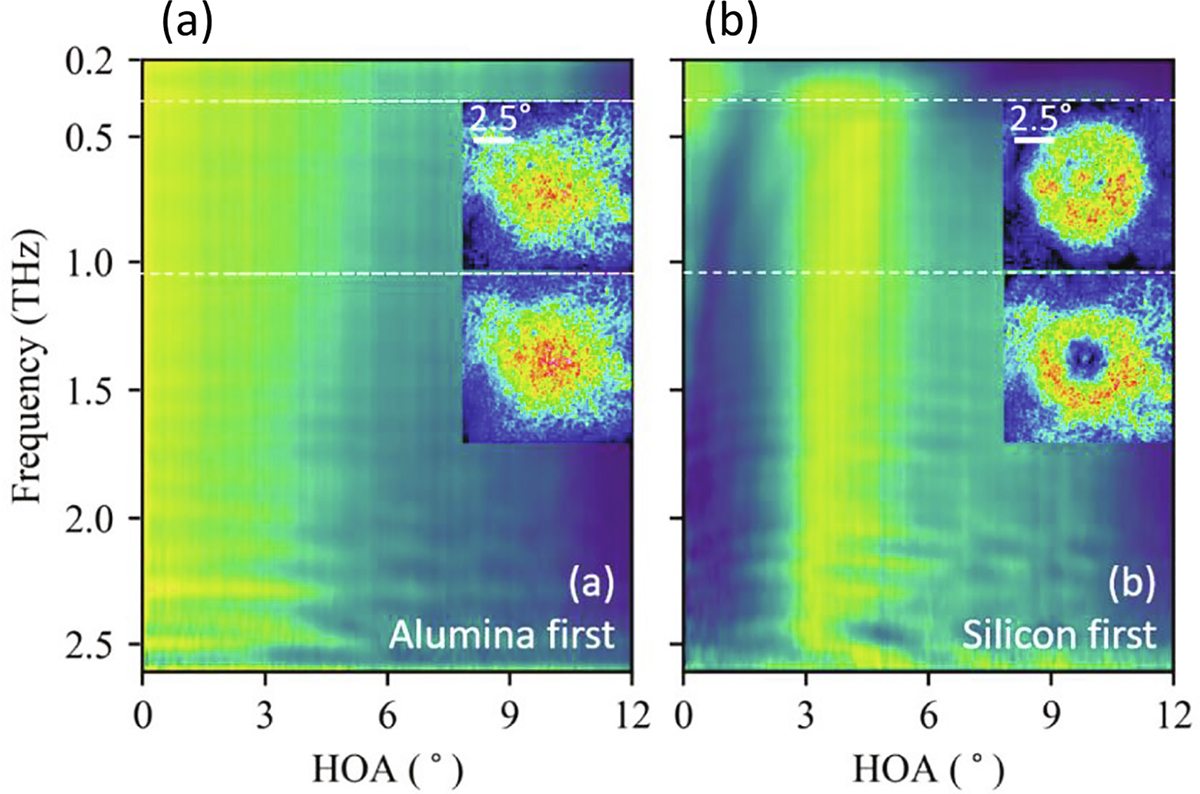
Coherent 2DEOS in ZnTe crystal. Evolution of THz amplitude as a function of frequency and HOA. (a) Alumina first. (b) Silicon first. Yellow color indicates a higher THz amplitude. Insets: 2D spatial distributions of the THz electric field at 0.37 THz and 1.05 THz (from Ref. [17]).
Current usage metrics show cumulative count of Article Views (full-text article views including HTML views, PDF and ePub downloads, according to the available data) and Abstracts Views on Vision4Press platform.
Data correspond to usage on the plateform after 2015. The current usage metrics is available 48-96 hours after online publication and is updated daily on week days.
Initial download of the metrics may take a while.