Fig. 4
Download original image
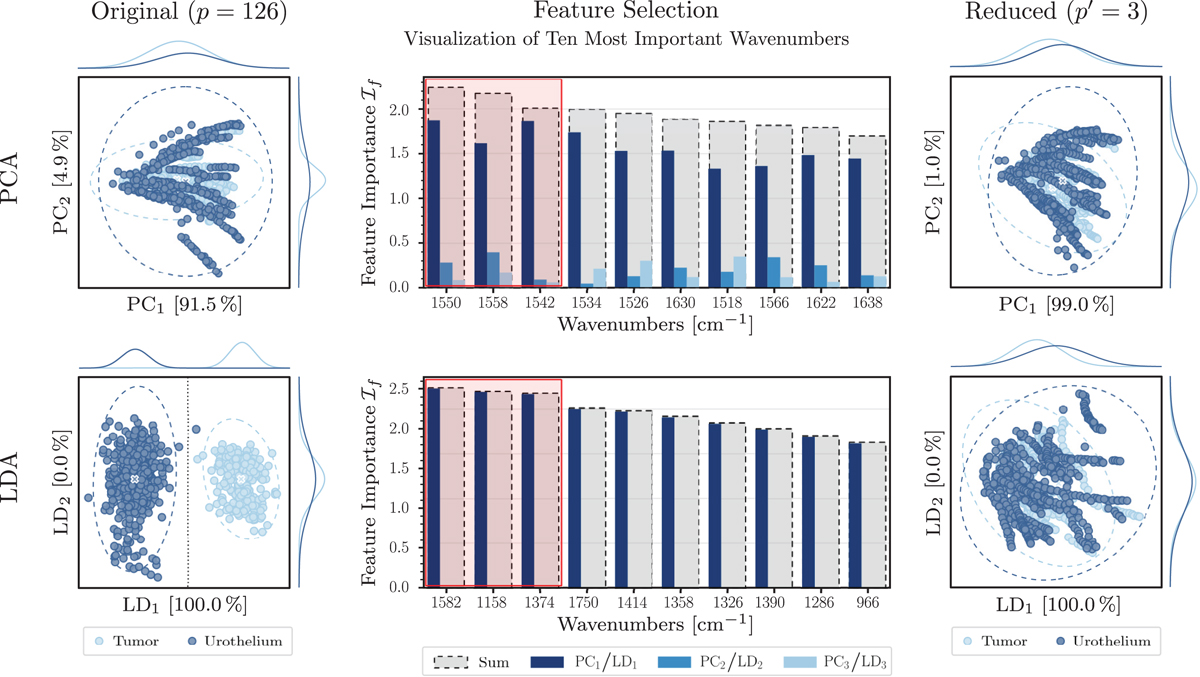
Comparison of the feature selection with PCA and LDA. The left side shows score plots of the complete spectra, where each point represents one measurement. Confidence intervals with 3σ are depicted as dashed ellipses and projected onto each component. The score plots on the right are calculated using only the p′ = 3 most important features (red rectangle). Note that the discriminative power of the LDA collapses.
Current usage metrics show cumulative count of Article Views (full-text article views including HTML views, PDF and ePub downloads, according to the available data) and Abstracts Views on Vision4Press platform.
Data correspond to usage on the plateform after 2015. The current usage metrics is available 48-96 hours after online publication and is updated daily on week days.
Initial download of the metrics may take a while.