Open Access
Fig. 12
Download original image
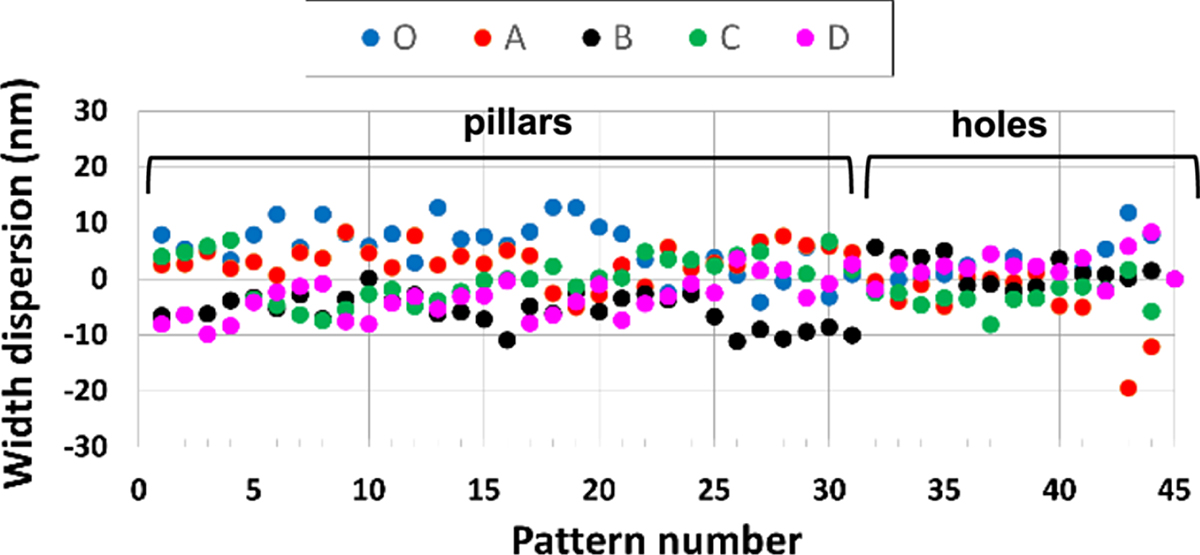
Measured width dispersion of the replicated patterns on different zones of the 3″ concave substrate. Horizontal axis corresponds to the number of the patterns. Each series of points corresponds to the zones of Figure 11.
Current usage metrics show cumulative count of Article Views (full-text article views including HTML views, PDF and ePub downloads, according to the available data) and Abstracts Views on Vision4Press platform.
Data correspond to usage on the plateform after 2015. The current usage metrics is available 48-96 hours after online publication and is updated daily on week days.
Initial download of the metrics may take a while.