Fig. 4
Download original image
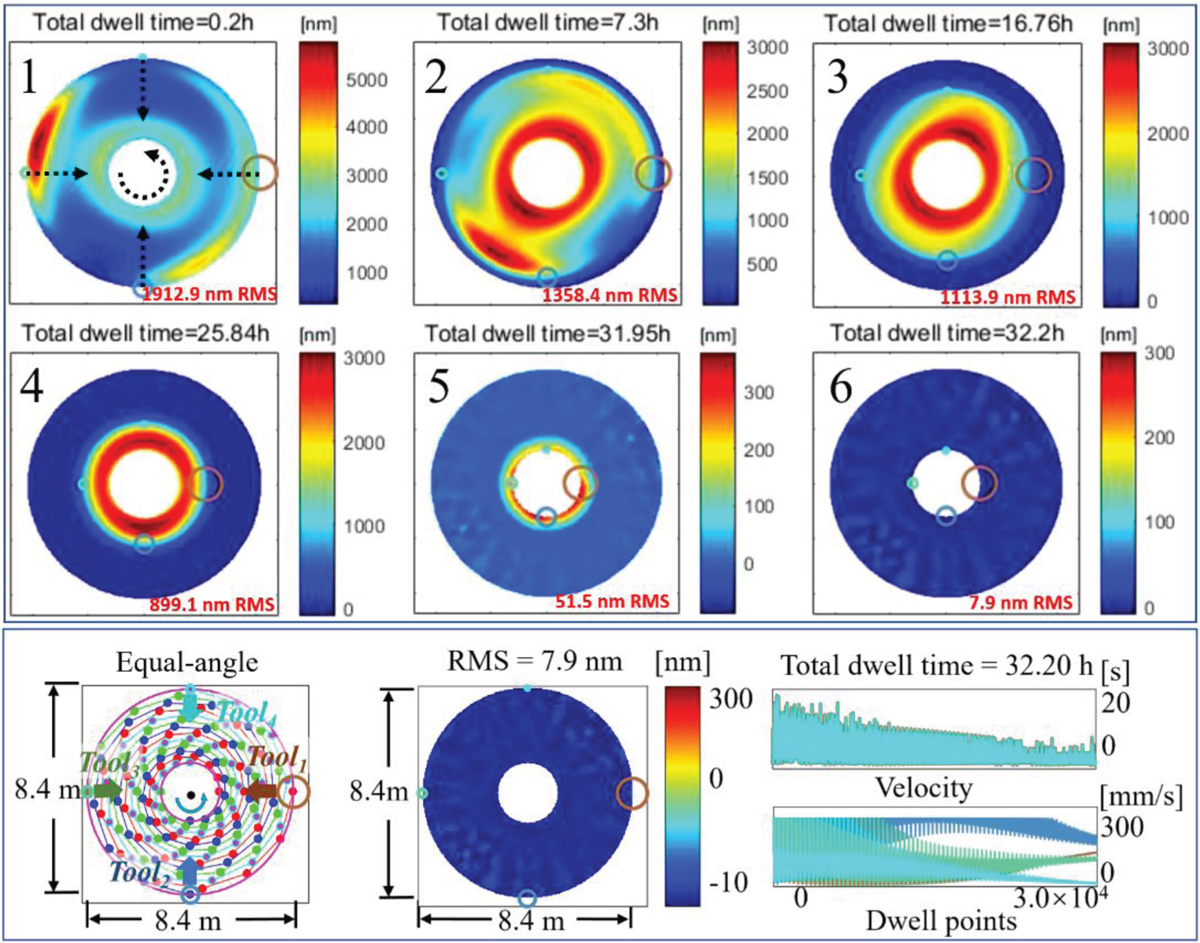
The top two rows show differential surface error maps at different progressive time instances obtained using the multi-tool multiplexing simulation (cumulated total dwell time runs from 1 through 6, note the changing scalebar), bringing down the initial (i.e., total dwell time = 0 h) surface figure error of 2210 nm RMS to 7.9 nm RMS using four tools simultaneously. The bottom row shows the tool path (left), final surface error map (middle), and time evolution of the CCOS run parameters (right).
Current usage metrics show cumulative count of Article Views (full-text article views including HTML views, PDF and ePub downloads, according to the available data) and Abstracts Views on Vision4Press platform.
Data correspond to usage on the plateform after 2015. The current usage metrics is available 48-96 hours after online publication and is updated daily on week days.
Initial download of the metrics may take a while.