| Issue |
J. Eur. Opt. Society-Rapid Publ.
Volume 22, Number 1, 2026
EOSAM 2025
|
|
|---|---|---|
| Article Number | 18 | |
| Number of page(s) | 5 | |
| DOI | https://doi.org/10.1051/jeos/2026010 | |
| Published online | 01 April 2026 | |
Short Communication
Luminescent thermal history sensing potential in Pr3+-activated YAG matrix
1
Warsaw University of Technology, Institute of Microelectronics and Optoelectronics, Koszykowa 75, Warsaw 00-662, Poland
2
Łukasiewicz Research Network Institute of Microelectronics and Photonics, al. Lotników 32/46, Warsaw 02-668, Poland
3
Faculty of Chemistry, Warsaw University of Technology, al. Noakowskiego 3, Warsaw 00-664, Poland
* Corresponding author: This email address is being protected from spambots. You need JavaScript enabled to view it.
Received:
30
December
2025
Accepted:
4
February
2025
Abstract
In this study, it was demonstrated that Pr3+-doped YAG powder can record thermal history in the temperature range of the template provided by 1100–1600 °C. Upon heating, the material undergoes irreversible structural phase transformations (YAM → YAP → single-phase YAG) induced by 2 h of thermal annealing, leading to permanent changes in both the emission intensity and the excited-state lifetime of Pr3+ ion. Temperature can be determined using two approaches: by analyzing the intensity ratio of the 3P0 → 3H4 and 1D2 → 3H4 emission bands, which increases linearly over 1300–1600 °C with a sensitivity of 0.001 °C−1, and by measuring the luminescence decay time of the 1D2 → 3H4 transition, which decreases linearly over 1100–1600 °C with a sensitivity of 0.38 μs °C−1. The combination of both methods enables durable and quantitative tracking of the material’s thermal history, confirming the suitability of YAG:Pr3+ powders for high-temperature diagnostics, thermal mapping, and monitoring of industrial processes.
Key words: YAG:Pr3+ / Thermal history sensor / Luminescence / Optical thermometry
© The Author(s), published by EDP Sciences, 2026
 This is an Open Access article distributed under the terms of the Creative Commons Attribution License (https://creativecommons.org/licenses/by/4.0), which permits unrestricted use, distribution, and reproduction in any medium, provided the original work is properly cited.
1 Introduction
Temperature is a key thermodynamic parameter in industrial and research applications [1]. At high temperatures, conventional measurement techniques such as thermocouples, resistance sensors, or pyrometers suffer from limitations related to physical contact and restricted material durability [2–4]. Moreover, rare-earth-doped optical fibers are typically unstable above ~ 1100 °C, limiting their use under extreme conditions [5]. Here, luminescence-based techniques offer a viable alternative. These methods are based on the emission of RE3+ ions embedded in crystalline hosts such as YAG, which undergo predictable and irreversible structural transformations after 2 h of thermal annealing. These transformations permanently modify the luminescence properties, enabling the material to function as a fluorescent thermal history sensor (THS) [6]. Pr3+ ions are particularly attractive activators due to their specific energy structure, enabling a broad excitation range and intense visible emission [7, 8].
In the Y2O3–Al2O3 system, increasing temperature induces a sequence of phase transitions – from YAM to YAP and finally to single-phase YAG above ~ 1600 °C [9]. Each phase provides a distinct local crystal field for Pr3+ ions, modifying electronic levels, phonon interactions, and thus luminescence properties [10]. Luminescence intensity [11] and lifetime [12] are strongly determined by the local crystal structure, which evolves irreversibly depending on both the temperature and duration of thermal exposure. Therefore, these changes can be exploited to construct a fluorescent THS. Crucially, these changes originate from irreversible phase transitions, enabling permanent recording of past thermal exposure and forming the basis of THSs, which allow reconstruction of the maximum temperature experienced by a material [10, 13]. Compared to temperature-indicating paints, phosphor powders offer superior chemical stability, quantitative readout, and applicability to complex geometries [13].
In the present work, YAG:1%Pr powder was investigated as a potential THS material. The analysis comprised two detection approaches based on the fluorescence intensity ratio (FIR) as well as an analysis of luminescence decay times. The FIR can be defined either as a comparison of the same emission peak measured at different temperatures [14, 15] or, more commonly in optical thermometry, as the ratio of two distinct emission peaks measured at the same temperature. The latter, self-referencing method, provides higher accuracy and greater robustness against fluctuations in excitation power, optical losses, and environmental conditions [11], and therefore constitutes the primary focus of the present study. In the second detection approach, the luminescence decay times of the 1D2 → 3H4 transition were analyzed. This transition is characterized by a significantly longer lifetime and a stronger temperature dependence than the 3P0 → 3H4 transition, which makes lifetime-based analysis a sensitive complementary tool for determining the maximum temperature reached during thermal exposure.
2 Materials and methods
The samples of yttrium-aluminum garnet doped with Pr3+ ions (general formula Y2.97Pr0.03Al5O12) were synthesized using a solid-state reaction assisted by high-energy milling, using high-purity commercial powders of Al2O3 (Krahn Ceramics, > 99.99%), Y2O3 (NYC YT3WP, 99.9%), and Pr6O11 (Thermo Scientific Chemicals, 99.996%). Stoichiometric amounts of the starting materials were mixed and milled with anhydrous ethanol (Chempur, 99.8%) and tetraethyl orthosilicate (Sigma-Aldrich), added at a concentration of 4.66 μL per gram of total mass. Planetary milling was carried out in a Fritsch Pulverisette 7 Premium Line system using 5 mm Si3N4 balls. The milling process consisted of ten cycles of 10 min at 300 rpm, each followed by a 10 min cooling break. An 80 mL silicon nitride jar and 250 milling balls were used. The slurry was dried on a hot plate at 80 °C for 24 h to remove ethanol. The powder was then subjected to two stages of thermal treatment in air muffle furnaces. In the first stage, the powder was heated to 600 °C at 5 °C/min (30 min dwell), then to 900 °C at 7 °C/min (30 min dwell). In the second stage, it was heated to 600 °C at 10 °C/min (15 min dwell), then to the target temperature of 1100–1600 °C at 10 °C/min (120 min dwell), followed by controlled cooling to 400 °C at 10 °C/min.
After annealing, the obtained powders were manually ground in an alumina mortar to obtain a homogeneous powder fraction suitable for subsequent characterization. The XRD patterns were collected in the 2θ range of 5–100° with a step size of 0.01° and a scanning rate of 2.0156° per minute. Cu Kα1 radiation (λ = 1.5406 Å) with a nickel filter was used. The quantitative phase composition and lattice parameters were evaluated by Rietveld refinement.
Emission spectra and excited-state lifetimes were measured at room temperature using an Edinburgh Instruments FS5 spectrometer with a 150 W xenon lamp, Czerny–Turner monochromators, an optical system optimized for powder measurements, and a temperature-stabilized single-photon-counting PMT (Hamamatsu R928). Spectra were corrected for instrumental response using FLUORACLE. Lifetime measurements were performed in time-resolved mode, and decay curves were fitted using dedicated exponential-fit routines in FLUORACLE to obtain Pr3+ emission lifetimes.
3 Results and discussion
3.1 Structural characterization
YAG:1%Pr3+ samples were synthesized and thermally treated at temperatures ranging from 1100 to 1600 °C for 2 h. Subsequently, XRD measurements were performed to analyse the crystalline structure formed at each annealing temperature. The XRD pattern of the sample annealed at 1600 °C, 1400 °C, and 1200 °C is presented in Figure 1.
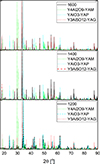 |
Figure 1 XRD pattern of YAG:1%Pr3+ annealed at 1200 °C, 1400 °C, 1600 °C, for 2 h, with overlaid reference lines of the best-matching phase standards from crystallographic databases. |
Phase identification analysis indicates that the sample annealed at 1200 °C for 2 h is multiphase, with a predominance of the intermediate YAP crystalline phase (YAP = 71.4 wt.%, YAM = 6.8 wt.%, YAG = 1.79 wt.%, Al2O3 = 19.7 wt.%, Y2O3 = 0.33 wt.%). With increasing annealing temperature, the content of the target YAG crystalline phase increases. At an annealing temperature of 1400 °C, the YAG phase becomes dominant (YAG = 92.1 wt.%, YAP = 5.01 wt.%, Al2O3 = 2.9 wt.%). Upon further increasing the annealing temperature to 1600 °C, a nearly single-phase YAG sample is obtained (YAG = 99.1 wt.%, YAP = 0.3 wt.%, YAM = 0.6 wt.%).
3.2 Emission spectra
The measured emission spectra of YAG:1%Pr3+ powders are shown in Figure 2.
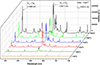 |
Figure 2 Emission spectra of YAG:1% Pr3+ samples annealed to different temperatures. |
As can be seen in Figure 2, the intensity of the emission lines varies with the temperature at which the crystalline phases were formed, showing an overall increase in peak intensities with increasing formation temperature. The intensities of the two strongest peaks exhibit distinct trends with annealing temperature: the 488 nm line increases more markedly, while the 611 nm line shows a comparatively weaker dependence. After thermal annealing at 1100 °C for 2 h, the luminescence is too weak to reliably determine the intensities of the 488 nm and 611 nm peaks.
Accordingly, the intensity ratio of the 3P0 → 3H4 (488 nm) and 1D2 → 3H4 (611 nm) transitions was measured as a function of annealing temperature (Fig. 3).
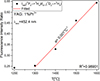 |
Figure 3 Change of peak intensity ratios as a function of temperature in YAG:1%Pr3+ powder. |
A linear increase in the 3P0 → 3H4/1D2 → 3H4 peak intensity ratio with increasing annealing temperature allowed calibration from 1300 to 1600 °C. The slope, determined by least-squares fitting, was 0.001 ± 7.49 × 10⁻⁵ °C−1, defining the powder’s temperature sensitivity.
3.3 Fluorescence decay time
An analysis of the change in excited-state decay times under the influence of temperature in the range of 1100 °C to 1600 °C was carried out. Figure 4 presents the examination of the 1D2 → 3H4 transition.
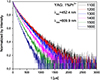 |
Figure 4 Luminescence decay curves resulting from the 1D2 → 3H4 transition in YAG:1%Pr powder, recorded after annealing at different temperatures ranging from 1100 to 1600 °C. |
Changes in the annealing temperature of the luminescent powder also affect the lifetimes of the excited states. As the annealing temperature increases, the luminescence decay time becomes shorter. At 1600 °C, a single-phase YAG sample with high symmetry and a regular crystal structure is obtained. Such a homogeneous environment promotes radiative transitions and stronger electron–photon interactions, resulting in shorter decay times.
At lower annealing temperatures, the powder is multiphase, initially composed mainly of YAM and YAP phases. Upon heating, these phases irreversibly transform into YAG, creating a more homogeneous environment as the temperature rises. The evolving crystal structure modifies the crystal field symmetry and the local environment of the active Pr3+ ions, thereby altering the intensity parameters and probabilities of electronic transitions. Consequently, the lifetime of the 1D2 level decreases as the annealing temperature increases.
The determined luminescence decay constants as a function of temperature are presented (Fig. 5).
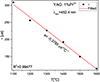 |
Figure 5 Measured lifetime of the 1D2 excited state of Pr3+ ions in YAG:1%Pr powder as a function of annealing temperature. |
A linear decrease in decay time with temperature allowed calibration from 1100 to 1600 °C. Least-squares fitting gave a slope of −0.3785 ± 0.0137 μs/°C, defining the powder’s temperature sensitivity.
4 Conclusions
In this article, the potential of YAG:1%Pr3+ powder as a THS is presented. It was demonstrated that the maximum temperature experienced by the investigated material during an 2-hour treatment can be determined by analysis of specific emission intensity ratios and luminescence decay times.The results show that by examining the intensity ratio of the 3P₀ → 3H4 (488 nm) and 1D2 → 3H4 (611 nm) transitions, temperature detection is possible in the range of 1300–1600 °C with a sensitivity of 0.001 ± 7.49 × 10⁻⁵ °C−1. Furthermore, it was shown that thermal history can also be determined based on the excited-state lifetimes of Pr3+ ions. Analysis of the luminescence decay time for the 1D2 → 3H4 transition (λexc = 454.2 nm, λobs = 609.9 nm) revealed that temperature detection in the range of 1100–1600 °C is achievable with a sensitivity of –0.3785 ± 0.0137 μs °C−1. Although the lifetime-based approach enables temperature sensing over a broader temperature range, (1100–1600 °C), the FIR method provides higher sensitivity, as the intensity ratio of the 3P₀ → 3H4 (488 nm) and 1D2 → 3H4 (611 nm) transitions changes more strongly with temperature than the 1D2 → 3H4 luminescence decay time. It was also observed that as the temperature at which the powder had been held decreases, the material transforms into a multiphase structure (YAM → YAP → YAG). This structural evolution changes the symmetry of the local environment of Pr3+ ions, resulting in reduced luminescence intensity and prolonged excited-state lifetimes. These correlations confirm that YAG:1%Pr3+ is a promising material for luminescence-based recording and readout of thermal history in high-temperature processes.
Funding
Presented research results were carried out as part of the 7th edition of the Implementation Doctorate programme funded by the Polish Ministry of Science and Higher Education.
Conflicts of interest
The authors declare that they have no competing interests to report.
Data availability statement
Data will be available after request
Author contribution statement
Conceptualization, O. Bogucki, M. Kaczkan and A. Kozłowska; Methodology, O. Bogucki; Validation, O. Bogucki, M. Kaczkan and A. Kozłowska; Formal Analysis, O. Bogucki; Sample synthesis, A. Pantoł-Boczon; Investigation, O. Bogucki; Resources, O. Bogucki; Data Curation, O. Bogucki; Writing – Review & Editing, O. Bogucki; Supervision, M. Kaczkan and A. Kozłowska.
References
- Feng J, Xiong L, Wang S, Li S, Li Y, Yang G, Fluorescent temperature sensing using triarylboron compounds and microcapsules for detection of a wide temperature range on the micro- and macroscale, Adv. Funct. Mater. 23, 340–345 (2013). https://doi.org/10.1002/adfm.201201712. [Google Scholar]
- Baker B, Temperature Sensing Technologies, AN673 (1998). Avalable at http://www.microchip.com. [Google Scholar]
- Douglas J, Smith C, Taylor S, An integrated approach to the application of high bandwidth optical pyrometry to turbine blade surface temperature mapping, in: Proceedings of the 18th International Congress on Instrumentation in Aerospace Simulation Facilites (IEEE, 1999). https://doi.org/10.1109/ICIASF.1999.827143. [Google Scholar]
- Kerr C, Ivey P, An overview of the measurement errors associated with gas turbine aeroengine pyrometer systems, Measure. Sci. Technol. 13, 873 (2002). [Google Scholar]
- Sun T, Zhang ZY, Grattan KTV, Erbium/Ytterbium fluorescence based fiber optic temperature sensor system, Rev. Sci. Instrum. 71, 4017 (2000). https://doi.org/10.1063/1.1289682. [Google Scholar]
- Yen WM, Shionoya S, Yamamoto H, Phosphor Handbook, 2nd ed (CRC Press/Taylor and Francis, Boca Raton, 2007). [Google Scholar]
- Sun H, Peng D, Wang X, Tang M, Zhang Q, Yao X, Green and red emission for (K0.5Na0.5)NbO3:Pr ceramics, J. Appl. Phys. 111, 046102 (2012). https://doi.org/10.1063/1.3686193. [Google Scholar]
- Wang B, Lin H, Yu Y, Chen D, Zhang R, Xu J, Wang Y, Ce3+/Pr3+: YAGG: a long persistent phosphor activated by blue light, J. Am. Ceram. Soc. 97, 2539 (2014). https://doi.org/10.1111/jace.12967. [Google Scholar]
- Ikesue A, Kinoshita T, Kamata K, Yoshida K, Fabrication and optical properties of high-performance polycrystalline Nd:YAG ceramics for solid-state lasers, J. Am. Ceram. Soc. 78, 4 (1995). https://doi.org/10.1111/j.1151-2916.1995.tb08433.x. [Google Scholar]
- Heyes A L, Rabhiou A, Feist JP, Kempf A, Thermal history sensing with thermographic phosphors, AIP Conf. Proc. 1552, 891 (2013). https://doi.org/10.1063/1.4821412. [Google Scholar]
- Tian Y, Tian Y, Huang P, Wang L, Shi Q, Cui C (2016) Effect of Yb3+ concentration on upconversion luminescence and temperature sensing behavior in Yb3+/Er3+ co-doped YNbO4 nanoparticles prepared via molten salt route, Chem. Eng. J. 297, 26. https://doi.org/10.1016/j.cej.2016.03.149. [Google Scholar]
- Shakirova JR, Shevchenko NN, Baigildin VA, Chelushkin PS, Khlebnikov AF, Tomashenko OA, Solomatina AI, Starova GL, Tunik SP, Eu-based phosphorescence lifetime polymer nanothermometer: a nanoemulsion polymerization approach to eliminate quenching of Eu emission in aqueous media, ACS Appl. Polym. Mater. 2, 537–547 (2020). https://doi.org/10.1021/acsapm.9b00952. [Google Scholar]
- Amiel S, Copin E, Sentenac T, Lours P, Le Maoult Y, On the thermal sensitivity and resolution of a YSZ:Er3+/YSZ:Eu3+ fluorescent thermal history sensor, Sens. Actuators A Phys. 272, 42–52 (2018). https://doi.org/10.1016/j.sna.2018.01.040. [Google Scholar]
- Chi F, Jiang B, Zhao Z, Chen Y, Wei X, Duan C, Yin M, Xu W, Multimodal temperature sensing using Zn2GeO4:Mn2+ phosphor as highly sensitive luminescent thermometer, Sens. Actuators B Chem. 296, 126640 (2019). https://doi.org/10.1016/j.snb.2019.126640. [Google Scholar]
- Zhao Z, Hu F, Cao Z, Chi F, Wei X, Chen Y, Duan C, Yin M, Highly uniform and monodisperse β-NaYF4:Sm3+ nanoparticles for a nanoscale optical thermometer, Opt. Lett. 43, 835–838 (2018). https://doi.org/10.1364/OL.43.000835. [Google Scholar]
All Figures
|
Figure 1 XRD pattern of YAG:1%Pr3+ annealed at 1200 °C, 1400 °C, 1600 °C, for 2 h, with overlaid reference lines of the best-matching phase standards from crystallographic databases. |
| In the text | |
|
Figure 2 Emission spectra of YAG:1% Pr3+ samples annealed to different temperatures. |
| In the text | |
|
Figure 3 Change of peak intensity ratios as a function of temperature in YAG:1%Pr3+ powder. |
| In the text | |
|
Figure 4 Luminescence decay curves resulting from the 1D2 → 3H4 transition in YAG:1%Pr powder, recorded after annealing at different temperatures ranging from 1100 to 1600 °C. |
| In the text | |
|
Figure 5 Measured lifetime of the 1D2 excited state of Pr3+ ions in YAG:1%Pr powder as a function of annealing temperature. |
| In the text | |
Current usage metrics show cumulative count of Article Views (full-text article views including HTML views, PDF and ePub downloads, according to the available data) and Abstracts Views on Vision4Press platform.
Data correspond to usage on the plateform after 2015. The current usage metrics is available 48-96 hours after online publication and is updated daily on week days.
Initial download of the metrics may take a while.